Figures & data
Table 1 Treatment schedule for all groups during weeks 6–9
Figure 1 Body-weight changes in all treatment groups (n=8 per group). *P<0.05, telmisartan vs vehicle.
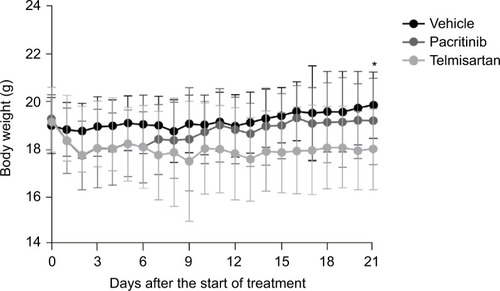
Figure 2 (A) Body weight, (B) liver weight, and (C) liver:body weight ratio on day of death.
Abbreviation: NS, not significant.
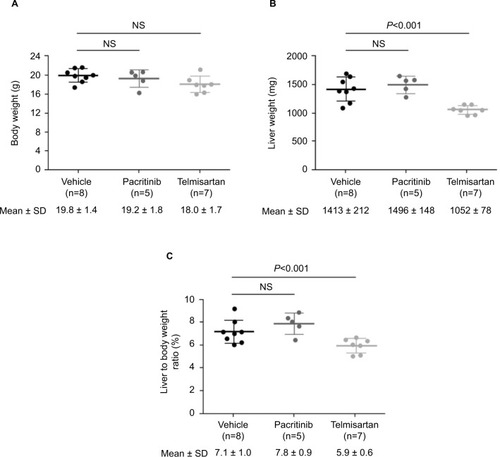
Figure 3 Representative micrography of H&E-stained liver sections on day of death.
Abbreviation: H&E, hematoxylin and eosin.
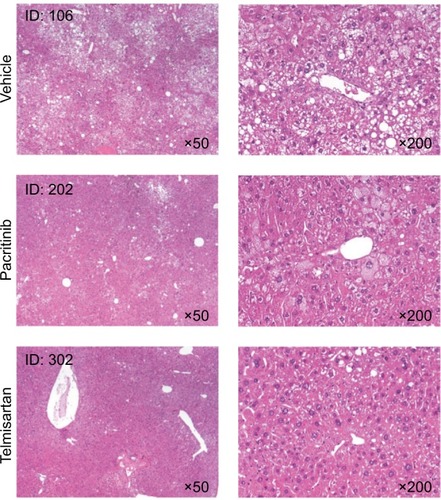
Figure 4 NAFLD-activity scores for all groups on day of death.
Abbreviations: NAFLD, nonalcoholic fatty-liver disease; NS, not significant.
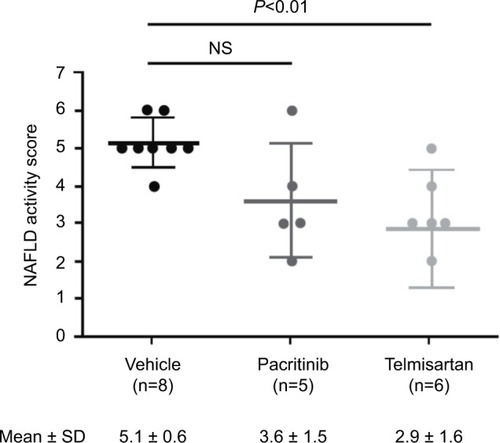
Figure 5 Representative photomicrographs of Sirius red-stained liver sections on day of death.
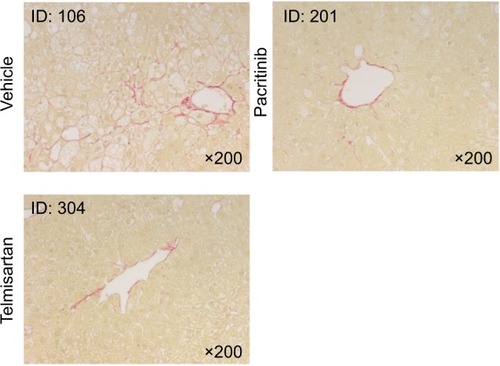
Table 2 Nonalcoholic fatty-liver disease-activity scoreCitation39
Figure 6 Plasma levels of CK18 fragment M30 on day of death.
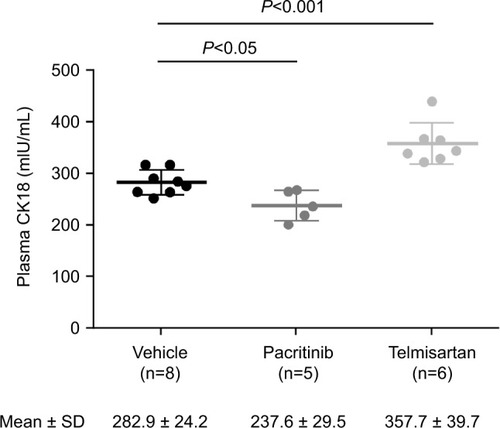
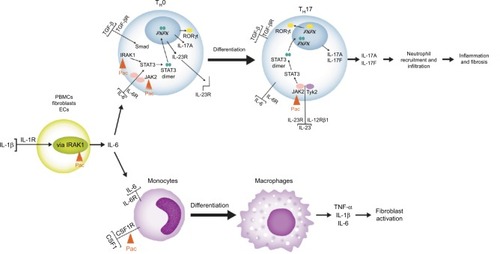
Figure 7 Inflammation pathways and potential pacritinib intervention points in fibrosis.
Notes: In peripheral blood monocytes, fibroblasts and endothelial cells, binding of IL1β induces IL6 secretion in a process involving IRAK1. Observed phenotypic reductions in IL6 levels induced by pacritinib may reflect IRAK1 inhibition, with downstream effects on inflammation, fibroblast activation, and fibrosis. Upper schema: in naïve T cells, binding of IL6 (together with TGFβ) ultimately induces differentiation into TH17 cells. Both JAK2 and IRAK1 (both of which pacritinib inhibits) are necessary for STAT3 activation; activated STAT3 dimerizes and translocates to the nucleus, where it binds to DNA, leading to expression of the transcription factor RORγt, which is critical for TH17-cell differentiation, and export of IL23R. In TH17 cells, IL23 binds to the IL23R/IL12Rβ1 receptor to activate STAT3 in another JAK2-dependent process; binding of the STAT3 dimer promotes expression of IL17A, while binding of RORγt promotes the expression of IL17A and IL17F, both of which are secreted by TH17 cells, leading to neutrophil recruitment and infiltration and downstream inflammation and fibrosis. Lower schema: IL6 acts as a switch to induce differentiation of monocytes to macrophages rather than dendritic cells; a second critical factor in monocyte differentiation is CSF1R, the kinase activity of which pacritinib also inhibits; macrophages secrete the proinflammatory cytokines TNFα, IL1β, and IL6, which are involved in fibroblast activation.
Abbreviations: Pac, pacritinib; PBMCs, peripheral blood mononuclear cells; ECs, endothelial cells.
Abbreviations: Pac, pacritinib; PBMCs, peripheral blood mononuclear cells; ECs, endothelial cells.