Figures & data
Figure 1 The molecular structures of doxycycline (top), curcumin (middle), and CMC 2.24 [1,7-bis-(4-hydroxyphenyl)–4-phenylaminocarbonyl-1E,6E-heptadien-3,5-dione] (bottom).
![Figure 1 The molecular structures of doxycycline (top), curcumin (middle), and CMC 2.24 [1,7-bis-(4-hydroxyphenyl)–4-phenylaminocarbonyl-1E,6E-heptadien-3,5-dione] (bottom).](/cms/asset/789cdefa-017e-49f3-88bd-6a59b4309032/djep_a_171119_f0001_b.jpg)
Figure 2 Outline of experimental groups and timeline.
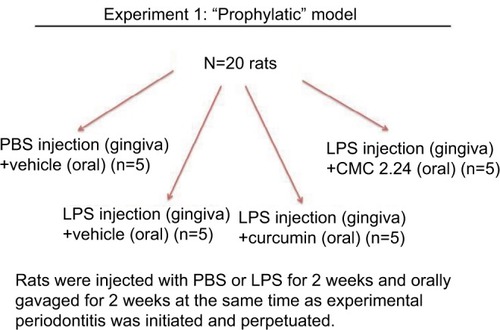
Figure 3 Diagram indicating the positions of the key study region of maxillary molar teeth in rats at positions 6, 7, 8, and 9.
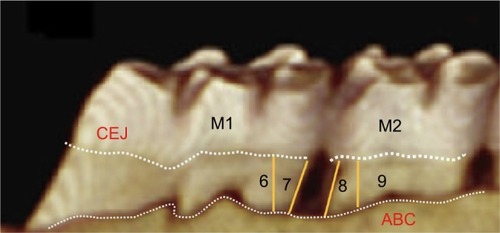
Figure 4 (A) Effect of curcumin on levels of TNF-α secreted by human monocytes. Human peripheral blood-derived monocytes (1×10⁶ cells/well) were cultured in serum-free media (37°C, 5% CO2/95% O2, 18 hours) with LPS (50 ng/mL) and with or without curcumin (2 or 5 µM). Conditioned medium was analyzed for TNF-α using ELISA. (B) Effect of CMC 2.24 on levels of TNF-α secreted by human monocytes. Human peripheral blood-derived monocytes (1×10⁶cells/well) were cultured in serum-free media (37°C, 5% CO2/95% O2, 18 hours) with LPS (50 ng/mL) and with or without CMC 2.24 (2 or 5 µM). Conditioned medium was analyzed for TNF-α using ELISA. The * denotes that the difference is statistically significant with P<0.05.
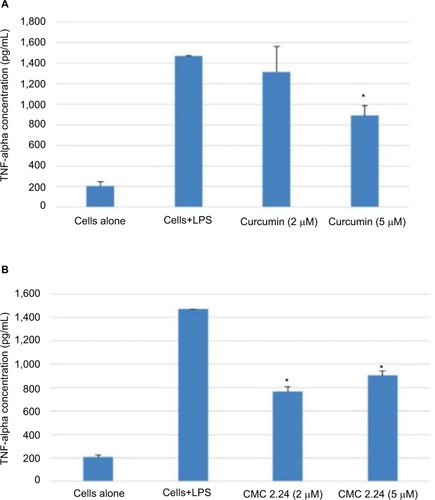
Figure 5 (A) Effect of curcumin on levels of IL-1β secreted by human monocytes. Human peripheral blood-derived monocytes (1×10⁶ cells/well) were cultured in serum-free media (37°C, 5% CO2/95% O2, 18 hours) with LPS (50 ng/mL) and with or without curcumin (2 or 5 µM). Conditioned medium was analyzed for IL-1β using ELISA. (B) Effect of CMC 2.24 on levels of IL-1β secreted by human monocytes. Human peripheral blood-derived monocytes (1×10⁶cells/well) were cultured in serum-free media (37°C, 5% CO2/95% O2, 18 hours) with LPS (50 ng/mL) and with or without CMC 2.24 (2 or 5 µM). Conditioned medium was analyzed for IL-1β using ELISA. The * denotes that the difference is statistically significant with P<0.05.
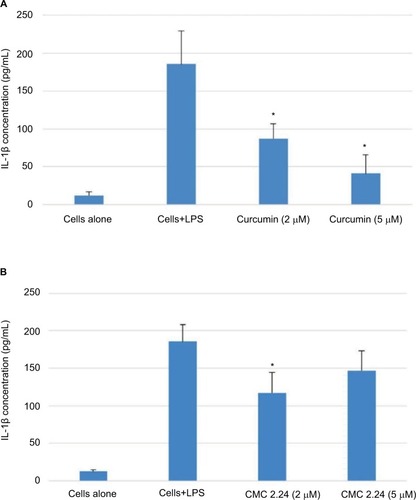
Figure 6 Effect of curcumin or CMC 2.24 on levels of MMP-9 secreted by human monocytes.
Abbreviations: CMC, chemically modified curcumin; LPS, lipopolysaccharide, MMP, matrix metalloproteinases.
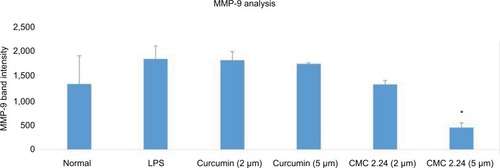
Figure 7 (A) Gel zymogram of MMP-2 and MMP-9 levels in rat gingiva. (B) Quantification of MMP-2 in rat gingiva from gel zymogram. (C) Quantification of MMP-9 in rat gingiva from gel zymogram.
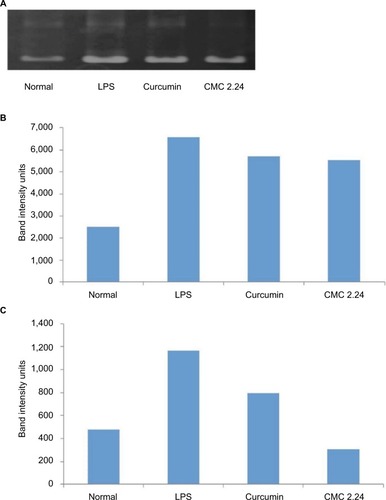
Figure 8 IL-1β concentration in rat gingiva.
Abbreviations: CMC, chemically modified curcumin; LPS, lipopolysaccharide.
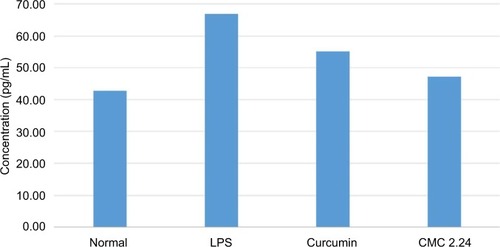
Figure 9 Activated MMP-9 levels in rat plasma.
Abbreviations: CMC, chemically modified curcumin; LPS, lipopolysaccharide, MMP, matrix metalloproteinases.
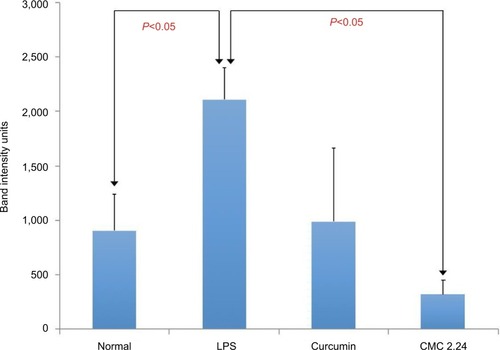
Figure 10 MMP-2 levels in rat plasma.
Abbreviations: CMC, chemically modified curcumin; LPS, lipopolysaccharide, MMP, matrix metalloproteinases.
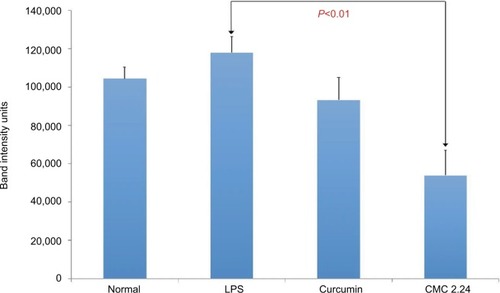
Figure 11 Representative periapical radiographs and morphometric images of each group.
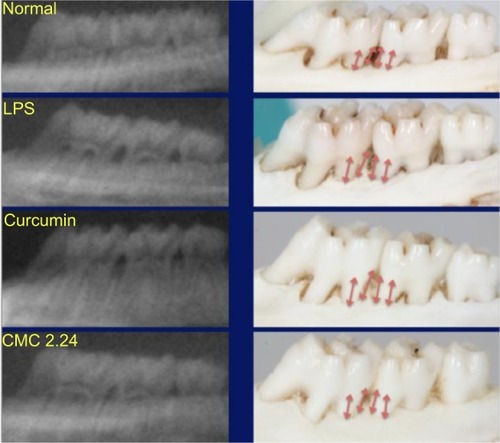
Figure 12 Morphometric analysis of maxillary bone loss at positions 6, 7, 8, and 9 on both the buccal and palatal aspects between the first and second molars.
Abbreviations: CMC, chemically modified curcumin; LPS, lipopolysaccharide.
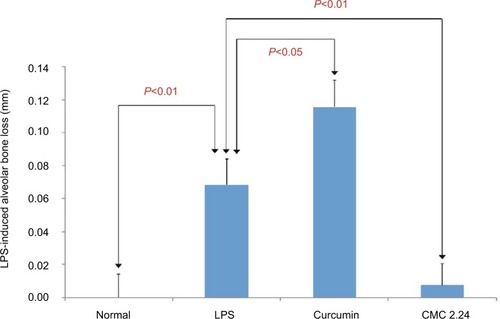
Figure 13 Morphometric analysis of maxillary bone loss at positions 6, 7, 8, and 9only on the palatal aspect between the first and second molars.
Abbreviations: CMC, chemically modified curcumin; LPS, lipopolysaccharide; NS, not significant.
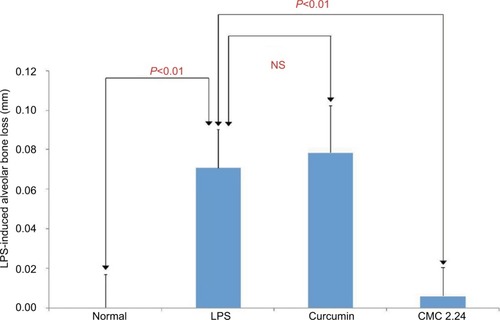
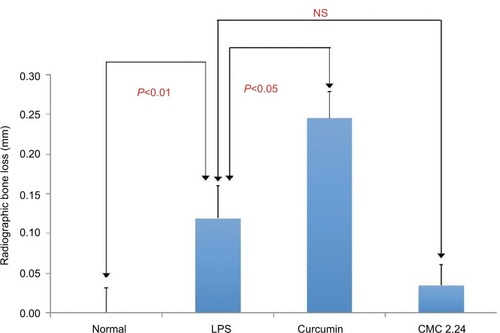
Figure 14 Radiographic analysis of maxillary bone loss at positions 7 and 8 between the first and second molars.
Abbreviations: CEJ, cemento-enamel junction; CMC, chemically modified curcumin; LPS, lipopolysaccharide; NS, not significant.