Figures & data
Table 1 Baseline functional data of C57BL/6 J (WT), APOE and APOE-HFD
Figure 1 Concentration–response curves for coronary flow (A), heart rate (B), and left ventricular developed pressure (C) for NECA in isolated perfused hearts from WT apolipoprotein E–knockout mice, and APOE-HFD.
Abbreviations: APOE, apolipoprotein E; APOE-HFD, APOE fed high-fat diet; HR, heart rate; LVDP, left ventricular developed pressure; NECA, 5′-N-ethylcarboxamide adenosine; WT, wild type.
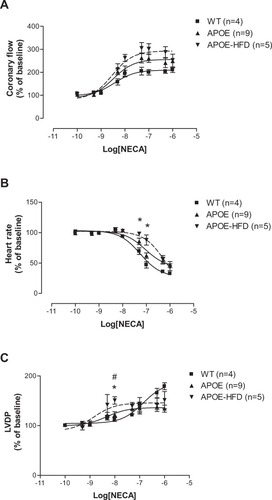
Figure 2 Concentration–response curves for coronary flow (A), heart rate (B), and LVDP (C) for CGS-21680 (CGS) in isolated perfused hearts from WT, APOE, and APOE-HFD.
Abbreviations: APOE, apolipoprotein E; APOE-HFD, APOE fed high-fat diet; LVDP, left ventricular developed pressure; WT, wild type.
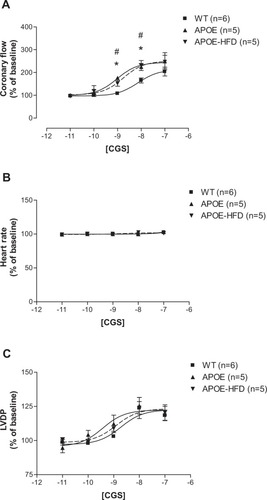
Figure 3 Concentration–response curves for coronary flow (A), Heart rate (B), and LVDP (C) for CCPA with or without 1 µM SCH-58261 (SCH) in isolated perfused hearts from WT and APOE-HFD.
Abbreviations: APOE, apolipoprotein E; APOE-HFD, APOE fed high-fat diet; CCPA, 2-chloro-N6-cyclopentyl-adenosine; LVDP, left ventricular developed pressure; WT, wild type.
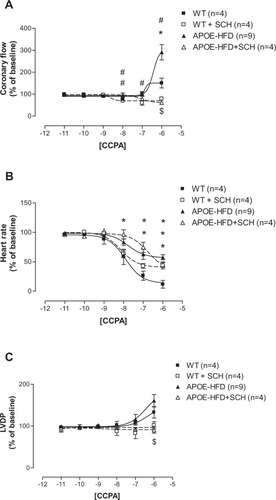
Figure 4 Concentration–response curves for changes in isometric tension produced by NECA in isolated aorta from WT, APOE, and APOE-HFD (A). Responses to 1 µM acetylcholine after preconstriction with 0.1 µM phenylnephrine in aortas from WT, APOE, and APOE-HFD (B).
Notes: *Significant difference from WT; #significant difference from APOE.
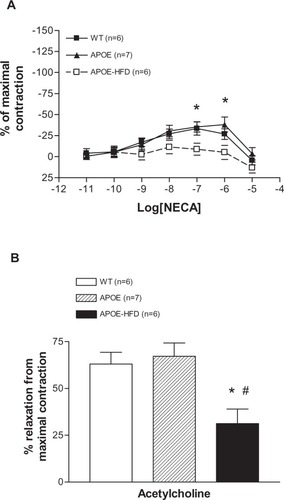
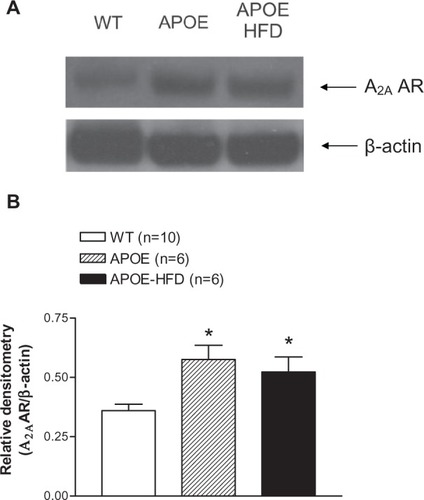
Figure 5 A representative A2A AR Western blot (A) and the densitometric analysis (B) of aortas from WT, APOE, and APOE-HFD. β-actin was used as a loading control.
Abbreviations: APOE, apolipoprotein E; APOE-HFD, APOE fed high-fat diet; A2A AR, A2A adenosine receptor; WT, wild type.