
Figures & data
Table 1 Body Weight, Left Ventricle Weight, LVW/BW Ratio, and Insulin Sensitivity Index of Rats at the End of Experiment
Table 2 Effect of Alpha-Mangostin on Liver Function Test and Renal Function Test of Rats at the End of 11 Weeks
Table 3 Effect of Alpha-Mangostin on Lipid Plasma of Rats at the End of 11 Weeks
Figure 1 Effects of alpha-mangostin on gene and protein expression of TNF-α. (A) Real-time PCR analysis shows that HF/HG/STZ-induced T2DM up-regulated the TNF-α mRNA, which was downregulated by the administration of alpha-mangostin in both doses and metformin. (B) ELISA analysis shows that HF/HG/STZ-induced T2DM upregulated the TNF-α protein expression, which was downregulated by the administration of alpha-mangostin in both doses and metformin. Data are presented as mean ± SD (n=6), and were analyzed using one-way ANOVA followed by Tukey’s post-hoc analysis. Values are considered significantly different at p < 0.05. *p < 0.05 HF/HG/STZ vs control and control-treated with alpha-mangostin. **p < 0.05 HF/HG/STZ vs HF/HG/STZ + Metformin. #p < 0.05 HF/HG/STZ vs HF/HG/STZ + AM 100. ##p < 0.05 HF/HG/STZ vs HF/HG/STZ + AM 200.
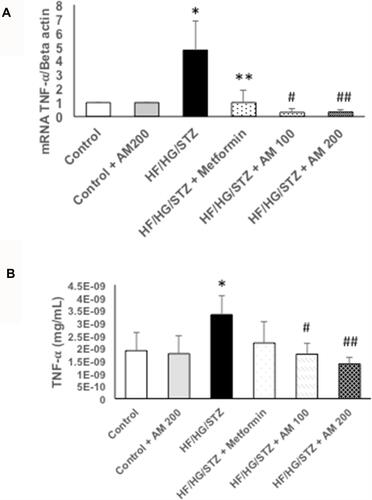
Figure 2 Effects of alpha-mangostin on protein expression of MCP-1, IL-1β, and IL-6. ELISA analysis shows that HF/HG/STZ-induced T2DM upregulated the (A) MCP-1, (B) IL-1β, and (C) IL-6 protein expression, which were downregulated by the administration of alpha-mangostin in both doses and metformin. Data are presented as mean ± SD (n=6), and were analyzed using one-way ANOVA followed by Tukey’s post-hoc analysis. Values are considered significantly different at p < 0.05. *p < 0.05 HF/HG/STZ vs control and control-treated with alpha-mangostin. **p < 0.05 HF/HG/STZ vs HF/HG/STZ + Metformin. #p < 0.05 HF/HG/STZ vs HF/HG/STZ + AM 100. ##p < 0.05 HF/HG/STZ vs HF/HG/STZ + AM 200.
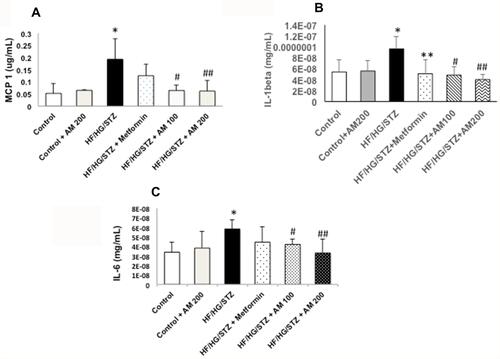
Figure 3 Effects of alpha-mangostin on histopathological changes. (A–F) Hematoxylin and eosin staining of the cross-sectional tissue slices of left ventricular depicting cardiomyocyte hypertrophy (×200). (A) control; (B) control-treated with AM 200; (C) HF/HG/STZ; (D) HF/HG/STZ + Metformin; (E) HF/HG/STZ + AM 100; (F) HF/HG/STZ + AM 200. Arrows in (C) indicate cardiomyocyte hypertrophy. (G) Bar graph shows quantitative analysis of cross-sectional area. Results are represented as mean ± SD and were analyzed using one-way ANOVA followed by Tukey’s post-hoc analysis. Values are considered significantly different at p < 0.05. *p < 0.05 HF/HG/STZ vs control and control-treated with alpha-mangostin. #p < 0.05 HF/HG/STZ vs HF/HG/STZ + AM 100.
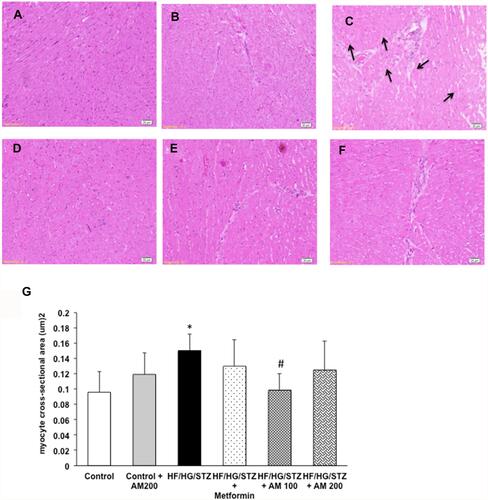
Figure 4 Effects of alpha-mangostin on cardiac fibrosis. (A–F) Masson’s trichrome staining for fibrosis of the cross-sectional tissue slices of left ventricular. Fibrosis is indicated by blue area as opposed to the red myocardium (×200). HF/HG/STZ administration for 11 weeks markedly enhanced fibrotic tissue in myocardium [C]. Treatment with metformin and alpha mangostin [D-F] reduced the fibrotic tissue in myocardium similar to that in control rats [A and B].
![Figure 4 Effects of alpha-mangostin on cardiac fibrosis. (A–F) Masson’s trichrome staining for fibrosis of the cross-sectional tissue slices of left ventricular. Fibrosis is indicated by blue area as opposed to the red myocardium (×200). HF/HG/STZ administration for 11 weeks markedly enhanced fibrotic tissue in myocardium [C]. Treatment with metformin and alpha mangostin [D-F] reduced the fibrotic tissue in myocardium similar to that in control rats [A and B].](/cms/asset/00343d59-282d-44b9-af4e-68ae5fdd138d/djep_a_12167264_f0004_c.jpg)