Figures & data
Figure 1 Timeline of Experiments. Rats were exposed to restraint stress (2 h/day for 10 days, PNDs 30–40). Then, the animals were subjected to SP treatment between PNDs 41 and 55 of age. Following the interventions, dendritic remodeling, BDNF levels, Oxidative stress markers and mRNA expression of BDNF and TrkB in amygdala were examined.
Abbreviations: PND, postnatal day; SP, Spirulina platensis; BDNF, brain-derived neurotrophic factor; TrkB, tropomyosin receptor kinase B.
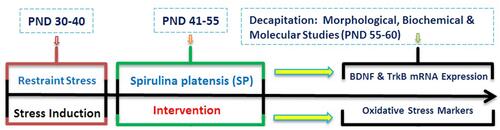
Table 1 Primer Sequences Used in Quantitative Reverse Transcriptase Polymerase Chain Reaction
Figure 2 Amygdala BDNF levels (% of control in left side, and actual data in right side) in stressed or non-stressed rats subjected to SP treatment. Chronic stress reduced amygdala BDNF, and treatment with SP restored this deficit. Data are expressed as mean±S.E.M. #P = 0.036 than the corresponding control group; ††P = 0.001 than the stressed group; *P = 0.047 than the control group. Five animals were used per each group.
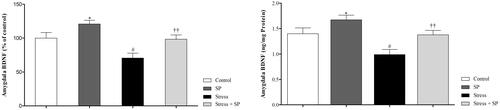
Figure 3 Amygdala BDNF (A) and TrkB (B) mRNA expression in stressed or non-stressed rats subjected to SP treatment. BDNF mRNA expression in the stress group was significantly lower than control group (A). Stressed rats showed decreased in TrkB mRNA expression than control group (B). Data are expressed as mean±S.E.M. In (A and B) #P = 0.01 than the corresponding control group; ††P = 0.001 than the stressed group; *P = 0.049; **P = 0.001 than the control group. Five animals were used per each group for molecular analysis.
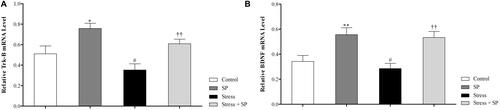
Figure 4 Apical dendritic remodeling of the BLA pyramidal neurons in stressed or non-stressed rats subjected to SP treatment. Stressed rats showed decreased dendritic length (A) and dendritic spines (B) in the BLA and treatment with SP alleviate these deficits. Computer-assisted reconstruction of BLA neurons (C). These neurons were selected because they are representative of dendritic lengths near their respective group means. (D) A photomicrograph of Golgi stained BLA neurons. Scale bar: 50 μm. Data are expressed as mean±S.E.M. In (A and B) #P = 0.01; ###P = 0.0001 than the corresponding control group; †††P = 0.0001 than the stressed group; **P = 0.001; ***P = 0.001 than the control group. Five animals were used per each group for morphological analysis.
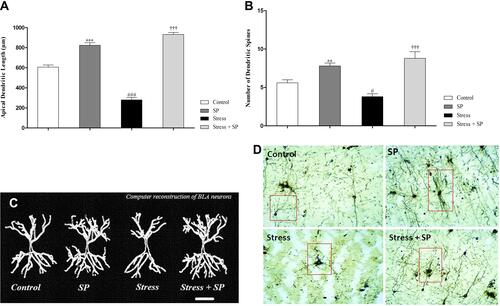
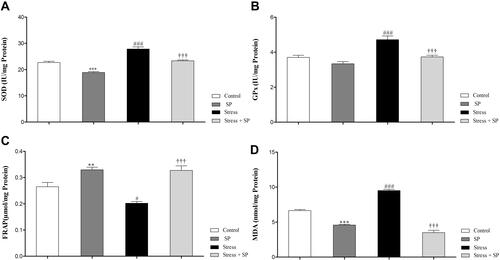
Figure 5 Oxidative stress markers and antioxidant enzymes activity in the amygdala of stressed or non-stressed rats subjected to SP treatment. Stressed rats showed increased SOD (A) and GPx (B) activities . FARP in the stress group was significantly lower (C) and MDA was significantly higher than control group (D). Data are expressed as mean±S.E.M. In (A, B, C, and D) #P = 0.01; ###P = 0.0001 than the corresponding control group; †††P = 0.0001 than the stressed group; **P = 0.001; ***P = 0.0001 than the control group. Five animals were used per each group.