Figures & data
Figure 1 The diagram of Cl-PEO test in animal.
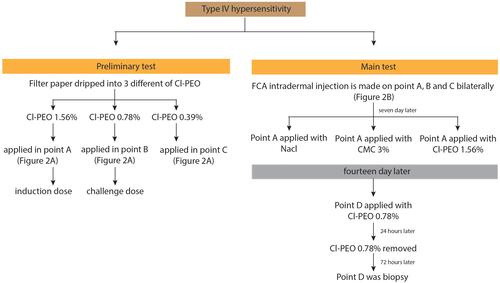
Figure 2 Type IV hypersensitivity model induced FCA in intrascapular region. (A) Point (AC) in main test. (B) applied topically Cl-PEO 0.78% (treatment group) and physiological solution (NaCl) and CMC 3% (control group) in point (D).
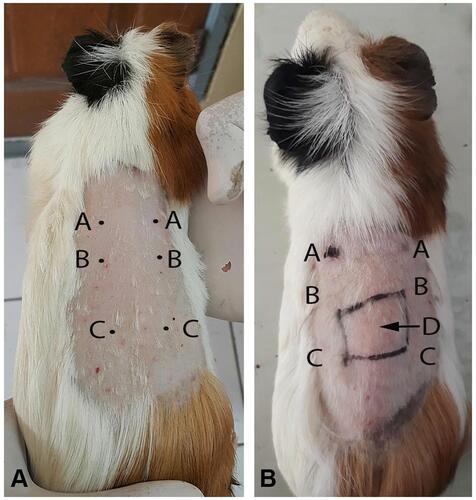
Table 1 Components Analysis of Citrus limon Using GC-MS
Figure 3 Number of lymphocytes using hematoxylin-eosin staining. (A) control group; (B) treatment group (observed using a light microscope with 400x magnification).
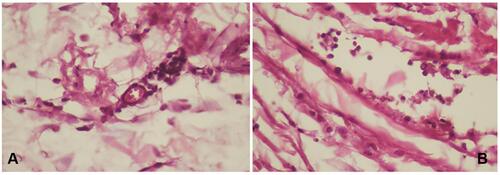
Figure 4 Number of macrophages using hematoxylin-eosin staining. (A) control group; (B) treatment group (observed using a light microscope with 400x magnification).
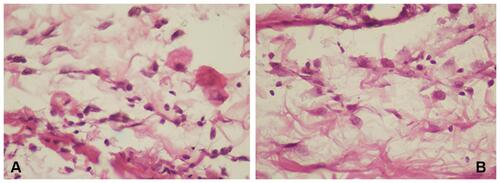
Table 2 Mean and Standard Deviation and Significant Level
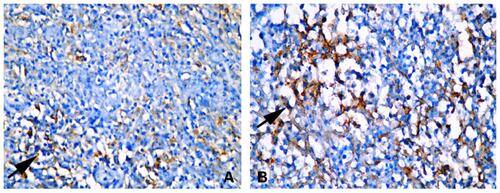
Figure 5 IFN-ɣ expression in macrophages (black arrow). (A) control group; (B) treatment group (observed using a light microscope with 400x magnification).
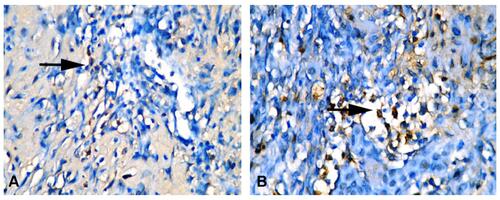
Figure 6 IL-10 expression in macrophages (black arrow). (A) control group; (B) treatment group (observed using a light microscope with 400x magnification).