Figures & data
Table 1 Phytochemical Constituents of the Root Bark Extracts of Croton Macrostachyus
Table 2 DPPH Scavenging Activities of Crude Extract and Solvent Fractions
Table 3 Effects of Crude Extract and Solvent Fractions on Liver Weight Variation
Table 4 Effects of Crude Extract and Fractions on Biochemical Parameters Against Paracetamol-Induced Hepatotoxicity in Mice
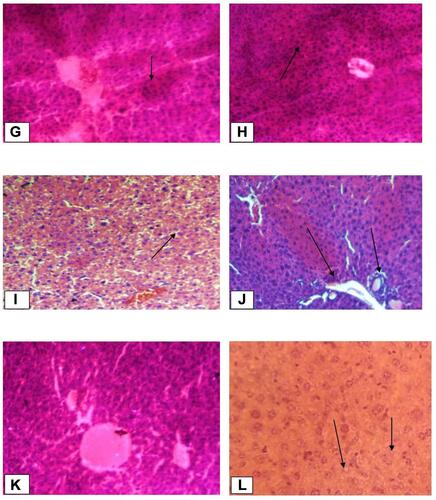
Figure 1 Continued.
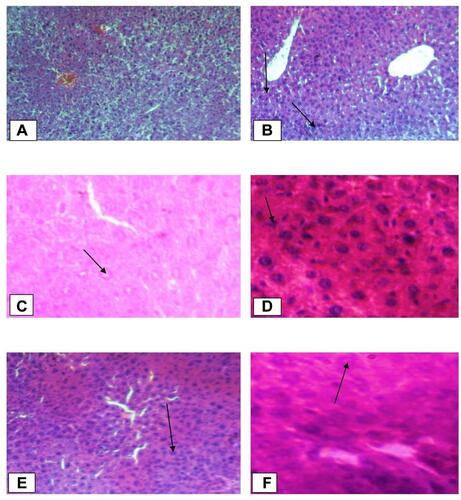
Figure 1 Histopathological changes of liver tissues (10x and 40x). (A) Normal control group (Normal hepatic cells with normal liver architecture) (B) paracetamol group (Necrotic hepatocytes, severe degeneration, hyperaemic/condensed blood vessels and cells with inflammation); Black arrow shows damaged hepatocytes. (C) Standard group (Liver architecture normal, cells with mild inflammation); Black arrow shows normal hepatocytes (D) Crude extract 100 mg/kg (Aggravated necrotic cells); Black arrow shows necrotized cells. (E) Crude extract 200 mg/kg (More necrotic hepatocytes and regenerated cells); Black arrow shows regenerated cells. (F) Crude extract 400mg/kg (Hepatocytes are normal in appearance with some mitotic figures); Black arrow shows normal hepatocytes. (G) Aqueous fraction 100mg/kg (Necrotized cells are by far more than normal cells); Black arrow shows necrotized hepatocytes. (H) Aqueous fraction 200 mg/kg (Normal hepatocytes are fewer than in Aqueous fraction 400mg/kg and haemorrhage); Black arrow shows haemorrhages. (I) Aqueous fraction 400 mg/kg (Most cells are normal with some dead cells and regenerated cells); Black arrow shows regenerated cells. (J) Chloroform fraction 100mg/kg (Shows inflammation and degeneration of hepatocytes); Black arrow shows degenerated cells. (K) Chloroform fraction 200 mg/kg (Mild inflammation and degeneration; regeneration). (L) Chloroform fraction 400mg/kg (Almost normal hepatocytes with mitotic figures); Black arrow shows normal hepatocytes.