Figures & data
Figure 1 The Justicia secunda plant.
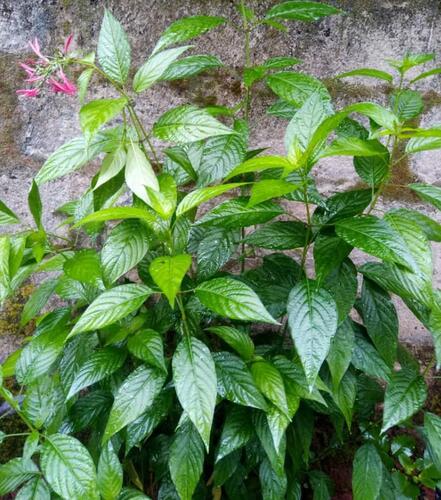
Table 1 Composition of the Plant Extract
Table 2 Effect of the Ethanolic Extracts of J. secunda on the Rats (Acute Toxicity Study)
Figure 2 Random blood glucose.
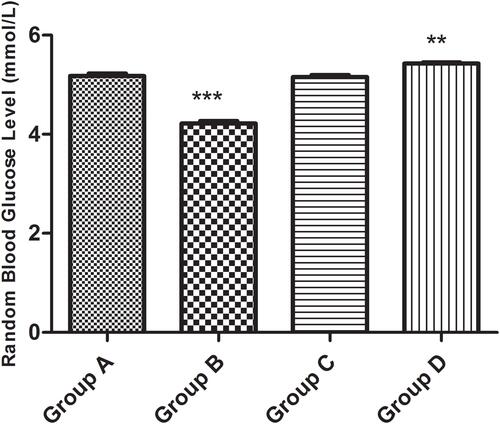
Figure 3 Liver function test (bilirubin levels). (A) Direct (unconjugated) bilirubin and (B) total bilirubin.
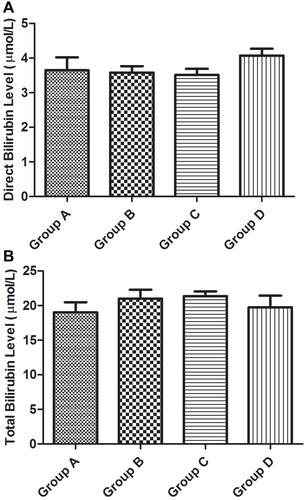
Figure 4 Liver function test (liver enzymes levels). (A) Alkaline phosphatase, (B) aspartate transferase and (C) alkaline transaminase.
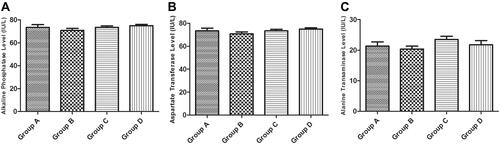
Figure 5 Lipid profile (A total cholesterol, B triglyceride, C high density lipoprotein, D low density lipoprotein).
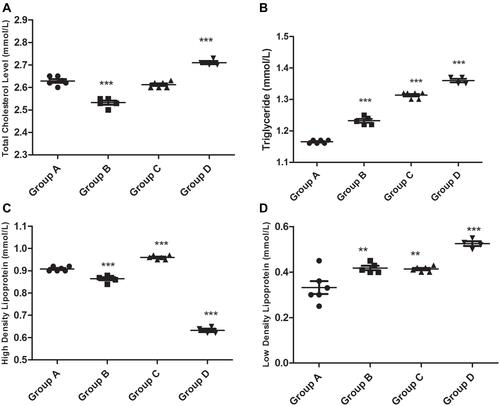
Figure 6 Kidney function (glomerular filtration). (A) Urea level, (B) creatinine level and (C) urea: creatinine ratio.
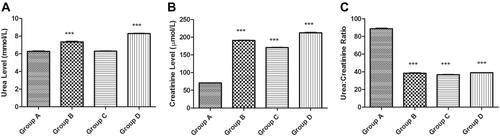
Figure 7 Kidney function (serum electrolytes concentration). (A) Potassium level, (B) sodium level, (C) bicarbonate level, (D) chloride level and (E) anion gap.
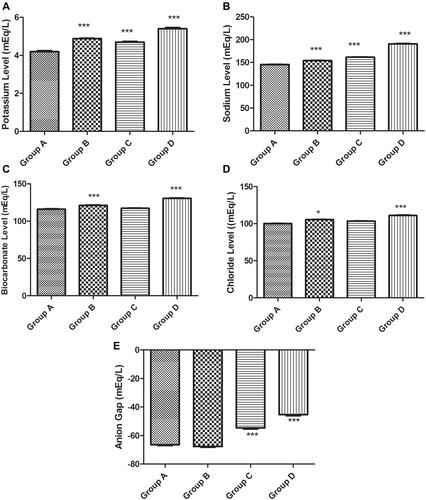
Figure 8 Hematological result. (A) White blood cells, (B) hemoglobin and (C) packed cell volume.
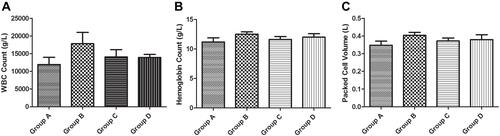
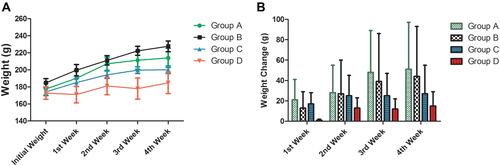
Figure 9 Weight results of the animals. (A) Animals’ weight and (B) animals weight.