Figures & data
Figure 1 The morphological changes of 3T3-L1 cells. (A) 3T3-L1 pre-adipocytes. (B) 3T3-L1 fibroblasts-derived adipocytes as validated by the Oil Red-O staining. Magnification: 40X, scale bars: 200 µm.
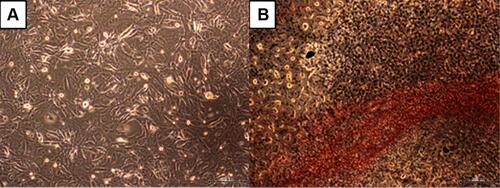
Figure 2 Glucose uptake in lipid-laden 3T3-L1 cells treated with different treatments: (I) control insulin, (II) control metformin, (III) control non-insulin, (IV) EECM 200 μg/mL, (V) EECM 50 μg/mL, (VI) curcumol 200 μg/mL, and (VII) curcumol 50 μg/mL. Data are presented as mean ± SD. Different symbols (a, b, c, d, e, f, and g) display a significant difference (p < 0.05) among treatments. ANOVA and DMRT were used for data interpretation (n= 3).
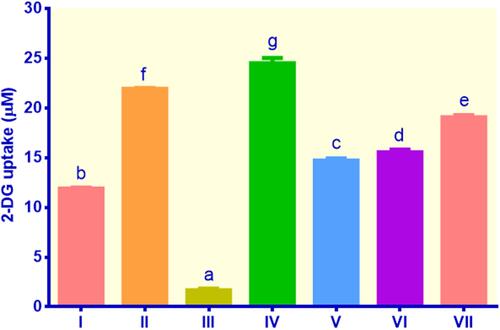
Figure 3 The expression of GLUT4 in lipid-laden 3T3-L1 cells treated with different treatments: (I) control insulin, (II) control metformin, (III) control non-insulin, (IV) EECM 200 μg/mL, (V) EECM 50 μg/mL, (VI) curcumol 200 μg/mL, and (VII) curcumol 50 μg/mL. Data are presented as mean ± SD. Different symbols (a, b, cd, de, and e) display a significant difference (p < 0.05) among treatments. ANOVA and DMRT were used for data interpretation (n= 3).
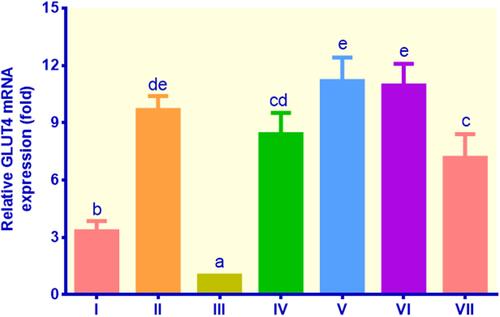
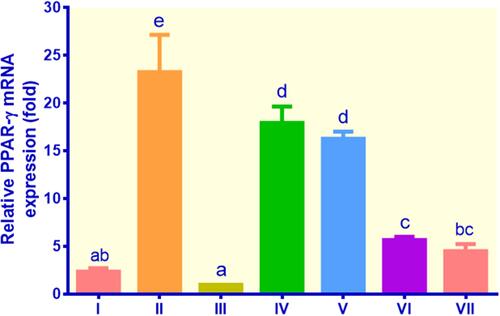
Figure 4 The expression of PPAR-γ in lipid-laden 3T3-L1 cells treated with different treatments: (I) control insulin, (II) control metformin, (III) control non-insulin, (IV) EECM 200 μg/mL, (V) EECM 50 μg/mL, (VI) curcumol 200 μg/mL, and (VII) curcumol 50 μg/mL. Data are presented as mean ± SD. Different symbols (a, ab, bc, c, d, and e) display a significant difference (p < 0.05) among treatments. ANOVA and DMRT were used for data interpretation (n= 3).