Figures & data
Table 1 Changes in the Wound Area Compared to Their Initial Size on Day 0 (%) in the Different Treatment Groups
Table 2 Wound Center Temperature (°С) in the Different Treatment Groups
Table 3 The Number of Leukocytes in the Center and Edges of Wounds On Day 3
Figure 1 The wound center by the end of the 3rd day after wound modeling, Control group. Hematoxylin–eosin staining. Magnification: X100 (bottom left) and x400 (right). Large scab (A), dense leukocyte infiltrate at the granulation tissue borders and in the scab ((B), magnification x400), leukocytes in scab deep layers, where the congested vessels are dilated ((C), magnification x400).
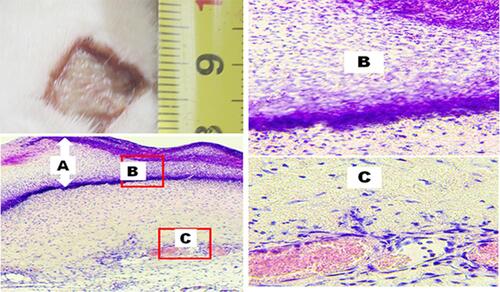
Figure 2 The wound crater center by the end of the 3rd day, DHB group. Abundant scab infiltration, tissue edema, and vessel plethora. Hematoxylin–eosin staining (Magnification: X40 and X100).
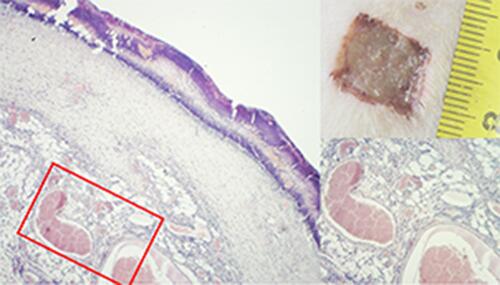
Figure 3 The wound crater center by the end of the 3rd day after wound modeling, Collagen group. Moderately present tissue edema and plethora, as well as moderate infiltration by leukocytes of all granulation layers. Hematoxylin–eosin staining. Magnification: X40 and X100.
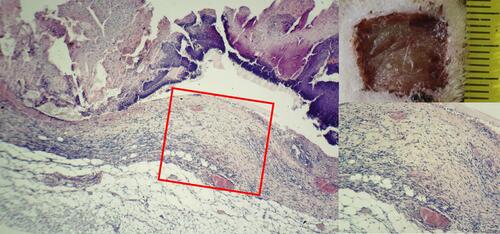
Figure 4 The wound crater center by the end of the 3rd day after wound modeling, SC group. The granulation tissue edema extends to deeper tissues. Hematoxylin–eosin staining. Magnification: X40, x400.
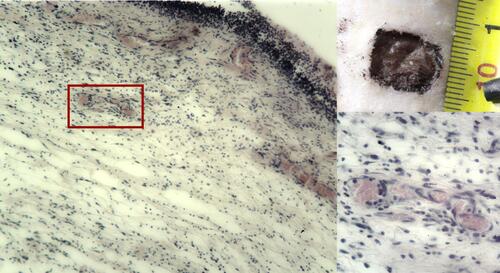
Table 4 The Number of Leukocytes in the Center and Edges of Wounds On Day 7
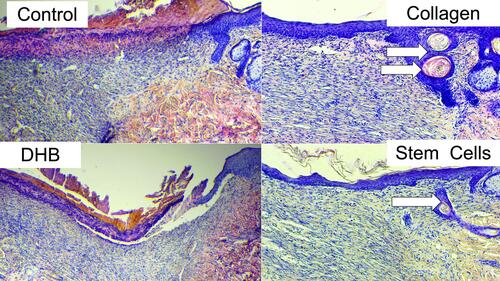
Figure 5 The wound edges in different groups on the 7th day of the study. Hematoxylin–eosin staining, magnification x100. The arrows indicate the newly formed epithelium, which was wider and contained more layers in the SC and Collagen groups than that in the Control and DHB groups. In the SC and Collagen groups, the epithelium was multilayered, creeping from the edge to the center, and gradually becoming thinner. In the DHB and Control groups, there were signs of initial marginal epithelialization (a short section of a 1-2 layered epithelium, which starts creeping from the wound edge).
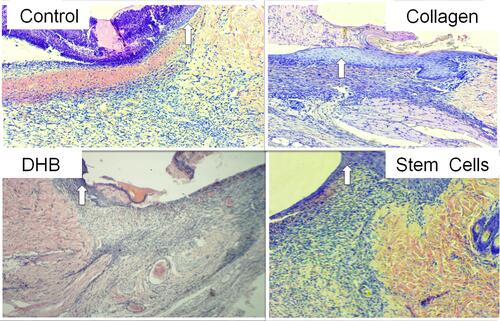
Table 5 The Number of Leukocytes in the Center and Edges of Wounds on Day 14
Figure 6 The wound edge view in different groups on the 14th day of the study. Arrows indicate the growth buds of the hair follicles. Hematoxylin–eosin staining, magnification x100.