
Figures & data
Table 1 IC50, Percent Cytotoxicity, and Percent CPE of Test Compounds (Influenza A-H1N1-VR219)
Table 2 Percent CPE of Test Compounds at Different Tested Concentrations (Influenza A-H1N1-VR219)
Table 3 IC50, Percent Cytotoxicity, and Percent CPE of Test Compounds (Beta Corona-OC43)
Table 4 Percent CPE of Test Compounds at Different Tested Concentrations (Beta Corona-OC43)
Table 5 Median Tissue Culture Infectious Dose in Mice Lungs following Treatment with Test Compounds
Figure 1 The effect of SSV-003 on cellular biomarker CD4+ after treatment. All values are expressed as the mean±SD (n=3, pooled samples of three animals in triplicate). Significant differences between the treated group and Virus control were analyzed by One-way ANOVA, followed by a Dunnett’s multiple comparison test, using GraphPad Prism at 95% confidence levels. *P<0.05 vs Virus control and $P<0.05 versus Remdesivir.
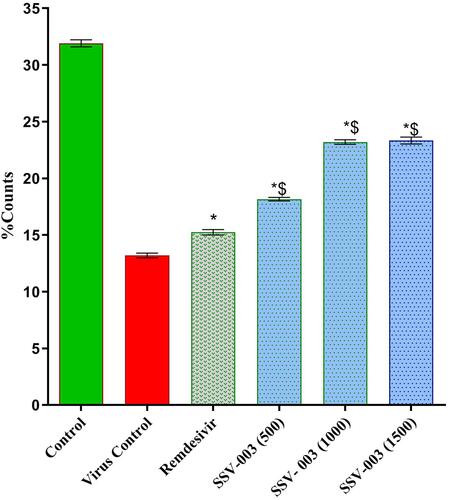
Figure 2 The effect of SSV-003 on cellular biomarker CD8+ after treatment. All values are expressed as the mean±SD (n=3, pooled samples of three animals in triplicate). Significant differences between the treated group and Virus control were analyzed by One-way ANOVA, followed by a Dunnett’s multiple comparison test, using GraphPad Prism at 95% confidence levels. *P<0.05 vs Virus control and $P<0.05 versus Remdesivir.
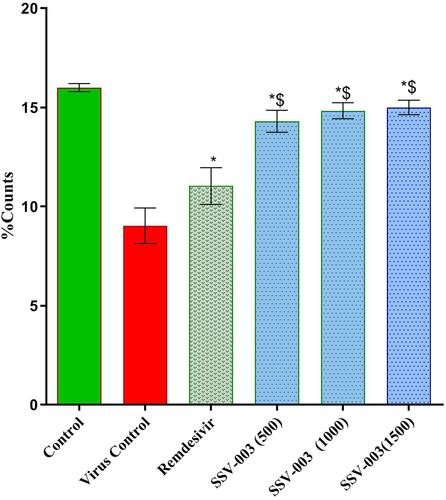
Table 6 Percent Increase in Immune Parameters as Compared to the Virus Control Group