Figures & data
Figure 1 Effect of NaCl 0.9%, AEAL (50 mg/kg/day) and L-NAME (40 mg/kg/day) on the systolic arterial pressure (SBP) in normotensive Wistar rats, (n = 4–5). Values were expressed as Mean ± SEM.; ***p<0.001 versus Control NaCl 0.9% group.
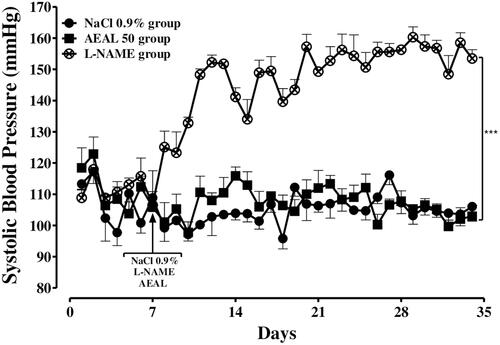
Figure 2 Effect of AEAL (10 and 50 mg/kg/day) and Captopril (5 mg/kg/day) on the systolic arterial pressure in L-NAME-induced hypertensive Rats, (n = 4–5). Values were expressed as Mean ± SEM.; *p<0.05; **p<0.01 ***p<0.001 versus L-NAME+Captopril group; §p <0.05 versus AEAL 50 group; #p<0.001 versus Control NaCl 0.9% group.
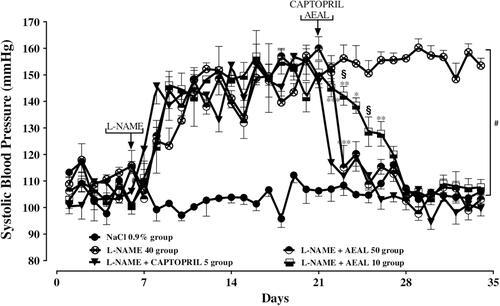
Figure 3 Effect of NaCl 0.9%, AEAL (50 mg/kg/day), L-NAME 40 mg/kg/day and simultaneous administration of L-NAME+AEAL (10 and 50 mg/kg/day) on Heart Rate of the Rats during experiment, (n = 4–5). Data were expressed as Mean ± SEM and were analyzed by two-way ANOVA followed by Bonferroni post-tests. ***p<0.001 versus Control NaCl 0.9% group; #p<0.05 versus AEAL 50 group.
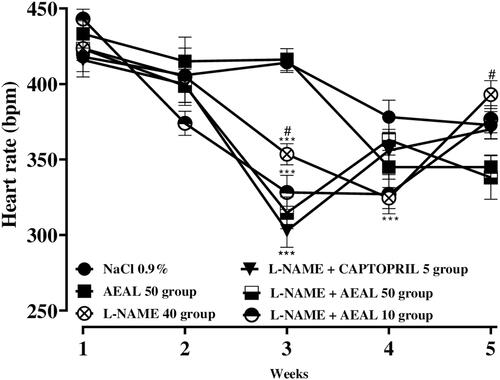
Figure 4 Effect of NaCl 0.9%; AEAL (50 mg/kg/day), L-NAME 40 mg/kg/day and simultaneous administration of L-NAME+AEAL (10 and 50 mg/kg/day) on the mass gain of animals during experiment, (n = 4–5). Values were expressed as Mean ± SEM.; **p<0.05; ***p<0.001 versus control NaCl 0.9% group; #p<0.01 versus L-NAME group.
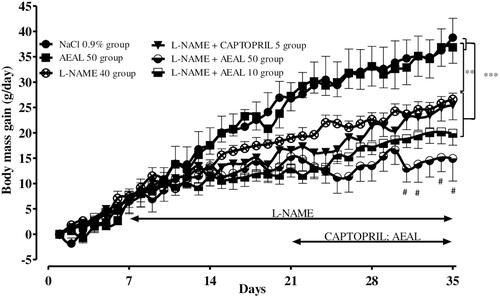
Figure 5 Histograms showed the effect of NaCl 0.9%, AEAL (50 mg/kg/day), L-NAME 40 mg/kg/day, the simultaneous administration of L-NAME+Captopril and L-NAME+AEAL (10 and 50 mg/kg/day) on (A) Average Food Intake (in percentage); (B) The corresponding effect during the 4 weeks of treatment, (n = 4–5). Data were expressed as Mean ± SEM and were analyzed by two-way ANOVA followed by Bonferroni post-tests. *p<0.05 versus Control NaCl 0.9% group; #p<0.05 versus AEAL 50 group.
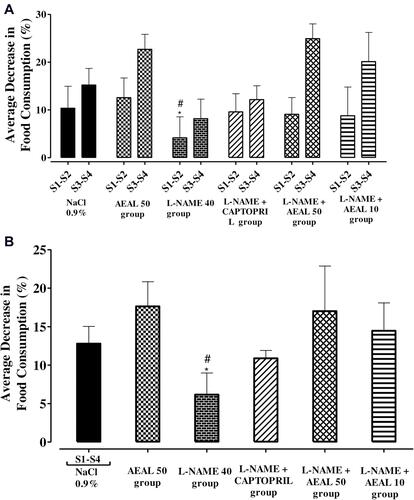
Figure 6 Histograms showed the effect of NaCl 0.9%, AEAL (50 mg/kg/day), L-NAME 40 mg/kg/day, the simultaneous administration of L-NAME+Captopril and L-NAME+AEAL (10 and 50 mg/kg/day) on (A) Average Water Intake (in percentage) and (B) The corresponding effect during the 4 weeks of treatment (in percentage), (n = 4–5). Data were expressed as Mean ± SEM and were analyzed by two-way ANOVA followed by Bonferroni post-tests. *p<0.05; **p<0.01 versus Control NaCl 0.9% group; #p<0.05 versus AEAL 50 group.
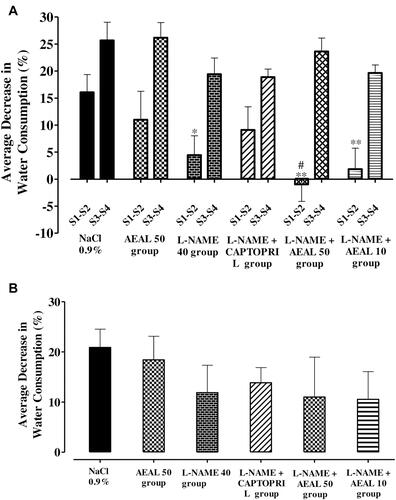
Table 1 Organs Weight from NaCl 0.9% Group; AEAL 50 Group; L-NAME Group and Simultaneous Administration of L-NAME+AEAL (10 and 50) Groups After 5 Weeks Experiment and Autopsy, (n = 4–5). Data Were Expressed as Mean ± SEM
Table 2 Biochemical Parameters of Serum from NaCl 0.9% Group; AEAL 50 Group; L-NAME Group and Simultaneous Administration of L-NAME+AEAL (10 and 50) Groups After 5 Weeks Experiment and Autopsy. (n = 4–5). Data Were Expressed as Mean ± SEM
Figure 7 Emax response to a single dose of Ach (10 µM) in isolated aortic rings from treated Rats after the end of experiment and precontracted with Phe 1 µM. Emax values were evaluated statistically using repeated-measures two-way ANOVA followed with a Bonferroni post-hoc test. Data were expressed as Mean ± SEM. **p < 0.01 versus control NaCl 0.9% group, (n = 4–5).
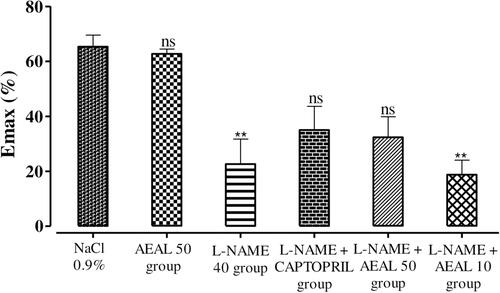
Figure 8 Cumulative concentration–response curves of Ach (10−9-10−5 M in isolated aortic rings from treated Rats after the end of experiment and pre-contracted with Phe 1 µM. Data were expressed as Mean ± SEM. *p < 0.05; **p < 0.01; ***p < 0.001 versus control NaCl 0.9% group (n = 3–5; One way ANOVA followed with a Dunnett’s Multiple Comparison and Bonferroni post-hoc tests were used).
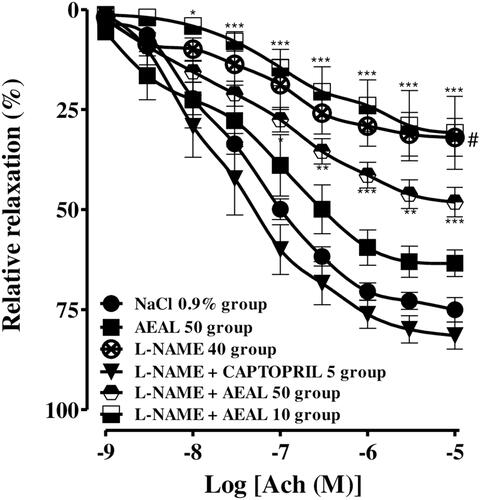
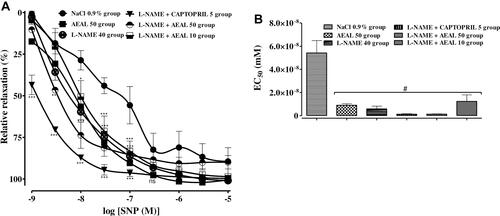
Figure 9 (A) Cumulative concentration–response curves of SNP (10−9-10−5 M in isolated aortic rings from treated Rats after the end of experiment and precontracted with Phe 1 µM. (B) The representative histogram of the corresponding EC50 values. Results are given as means ± SEM. where n = 4–5 different experiments. *p < 0.05; **p < 0.01; ***p < 0.001 versus Control NaCl 0.9% group (Two-way ANOVA with Bonferroni’s post hoc test was used); #p < 0.001 versus Control NaCl 0.9% group (One way ANOVA with Bonferroni’s post hoc test was used).