
Figures & data
Table 1 Phytochemical Investigation of Solvent Fractions of A. schimperi Leave
Table 2 Zone of Inhibition (in mm) of the Different Concentrations of DCM Fraction of A. schimperi Leave Against the Tested Bacteria
Table 3 Zone of Inhibition (in mm) of the Different Concentrations of TCM Fraction of A. schimperi Leave Against the Tested Bacteria
Table 4 Zone of Inhibition (in mm) of the Different Concentrations of PE Fraction of A. schimperi Leave Against the Tested Bacteria
Table 5 Zone of Inhibition (in mm) of the Different Concentrations of EA Fraction of A. schimperi Leave Against the Tested Bacteria
Figure 1 Zone of inhibition of A. schimperi TCM (A) and EA (B) fraction against S. typhi(+ve CAF disc as a positive control and 5%DMSO as a negative control).
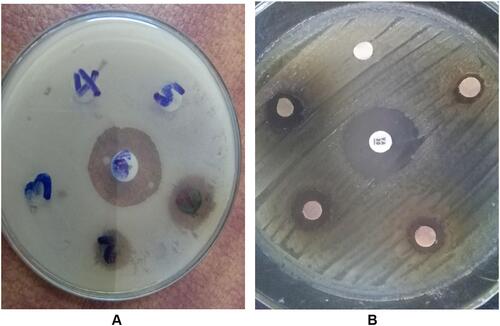
Figure 2 Agar well diffusion test by PE fractionate of the leaves of A. schimperi against K. pneumoniae. (+ve CAF disc as a positive control and 5% DMSO as a negative control).
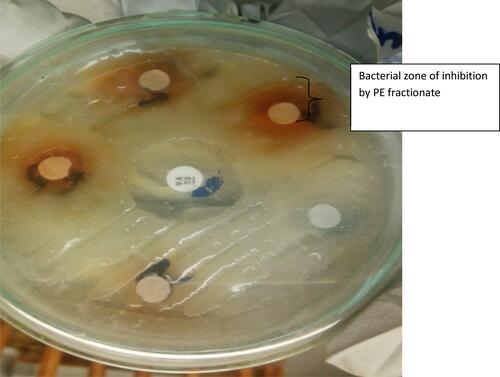
Table 6 The MIC (in mg/mL) of the Solvent Fractions of the Leaves of A. schimperi Against Tested Bacteria
Table 7 The MIC (in mg/mL) of the Solvent Fractions of the Leaves of A. schimperi Against Tested Bacteria