Figures & data
Figure 1 Study schematic for the safety pharmacology evaluations conducted in rats. Animals were assigned to the study using a computerized procedure designed to achieve body weight balance with respect to subgroup assignment. Eight males (M) per group underwent plethysmography evaluation and eight females (F) per group underwent FOB and locomotor activity assessments. Dose levels and concentrations were expressed as the maleate salt and based on trazpiroben as supplied with no correction. Group 1 received the control formulation only. Day 1 of the dosing phase is defined as the first day of dosing for each sex.
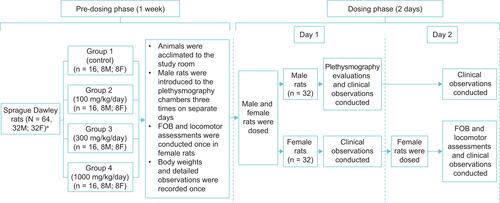
Table 1 FOB Assessments Conducted in Female Rats During the Pre-Dose Phase and Approximately 0.5 Hours Post-Dose on Day 2 of the Dosing Phase
Table 2 Blood Sampling Schedule for Bioanalytical and Toxicokinetic Analyses of Trazpiroben in Rats During the Dosing Phase
Figure 2 Study schematic for the safety pharmacology evaluations conducted in male dogs. Animals were dosed in ascending order based on dose level and received each dose once in a unique dosing sequence. Washout periods of 2 days were included between dosing. Animals in the control group received the same amount of control article in capsules as the number of trazpiroben capsules administered to the animal in the high-dose level designation at each interval. aDogs were abdominally implanted with an ECG, blood pressure, and body temperature transmitter ≥ 2 weeks before study initiation. bCardiovascular (CV) assessments in the dosing phase were recorded for at least 90 minutes before dosing.
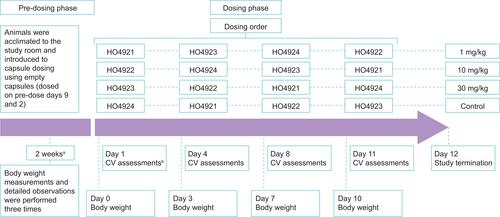
Figure 3 Mean locomotion parameters. (A) Basic movement, (B) Fine movement, (C) Horizontal and vertical ambulation, and (D) Rearing activity, as measured in female rats following receipt of trazpiroben during the dosing phase. FOB assessments were conducted at approximately 30 minutes post-dose. Locomotor activity was assessed within 10 minutes following the end of the FOB assessment for each animal and was measured for a total of 40 minutes. *Statistical significance was determined at p ≤ 0.05.
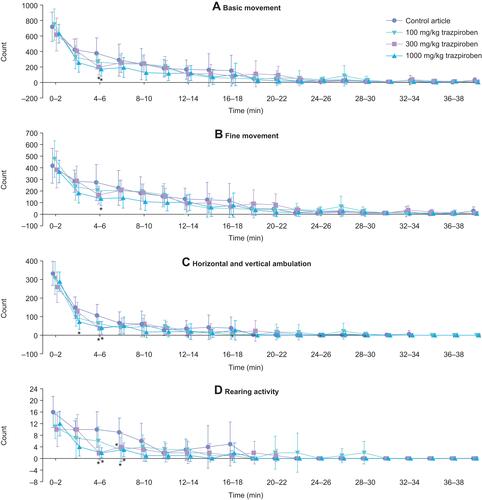
Figure 4 Mean (± standard error mean) tidal volume in male rats undergoing plethysmography evaluations during the dosing phase. *Statistically significantly different from data from animals given 0 mg/kg at p < 0.05.
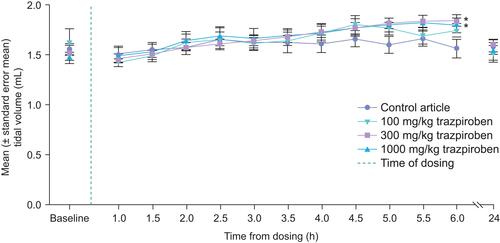
Table 3 Toxicokinetic Parameters for Trazpiroben in Rat Plasma for Day 1
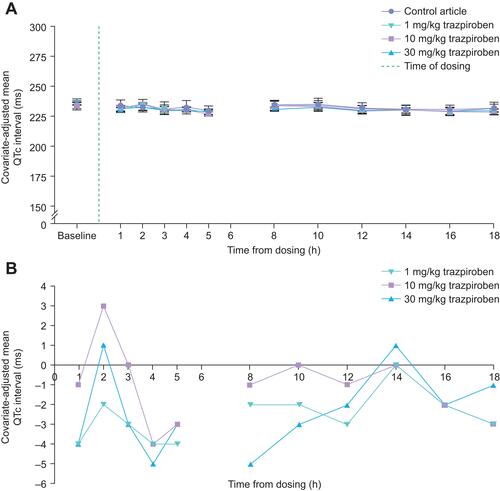
Figure 5 Heart rate-corrected QT (QTc) intervals of instrumented male beagle dogs during study dosing phase: (A) Mean (± standard error mean) QTc interval; (B) Change in mean QTc interval versus time-matched control article.