
Figures & data
Figure 1 Showed the XRD patterns of ZnO (A), Ag/ZnO (B) and zeolite-supported Ag/ZnO (C) nanoparticles, respectively.
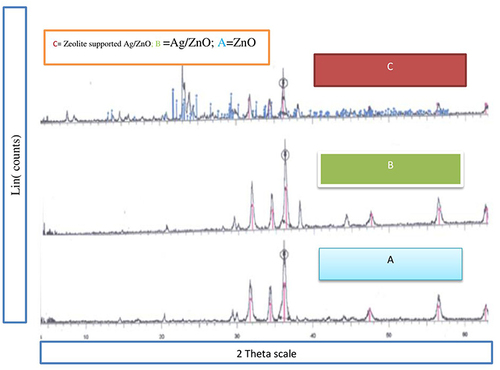
Table 1 Calculated Average Crystallite Size (D) of the Nanoparticles
Table 2 The Concentrations of Ag and Zn in the Synthesized ZnO, Ag/ZnO Nano Particles
Figure 2 Showed the FTIR spectra of ZnO (A), Ag/ZnO (B), and zeolite-supported Ag/ZnO (C) nanoparticles.
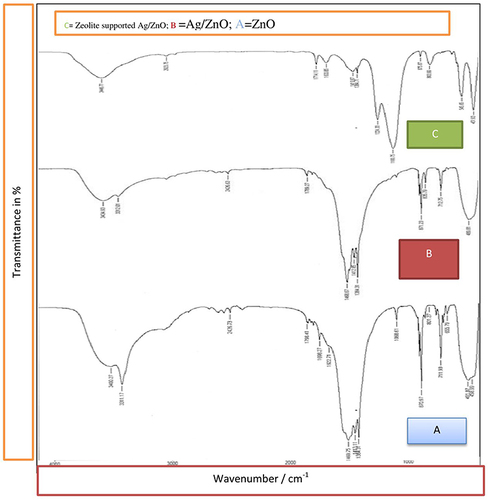
Table 3 Inhibition Zone of Bacterial Growth Inhibition (mm)