
Figures & data
Figure 1 The four anatomical sites selected for administering the Injection Harsha 22.
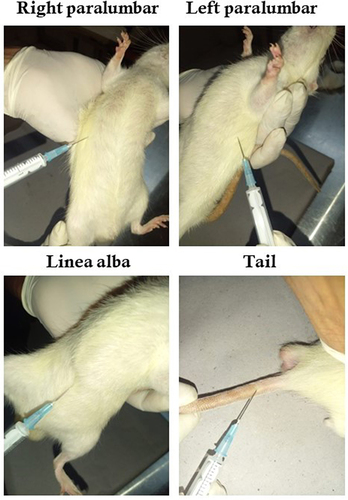
Table 1 Sterility Test Result of Injection Harsha 22
Figure 2 Tail flick latencies of rats after treatment with Injection Harsha 22 at different time intervals. Here Control: Normal saline, Test- Injection Harsha 22 and Standard- Lignocaine.
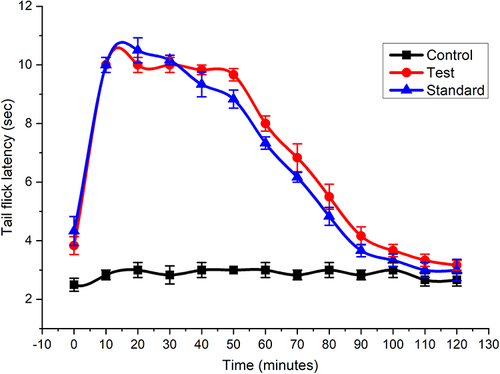
Figure 3 (A) Maximum possible effects - MPE (%) and (B) Area under the curve (AUC) of treatment groups at different time intervals. Here Control: Normal saline, Test- Injection Harsha 22 and Standard- Lignocaine.
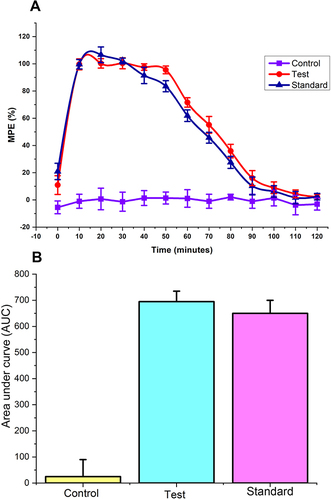
Table 2 Ranking of Analgesia at Different Anatomical Sites Anaesthetized with Injection Harsha 22. Data are of 3 Replicates ± SEM; 0–25 = No Analgesia; 25–50 = Low Analgesia; 50–75 = Moderate Analgesia; 75–100 = High Analgesia
Figure 4 Percentage (%) of animals with analgesia after treatment. Here Control: Normal saline, Test- Injection Harsha 22 and Standard- Lignocaine.
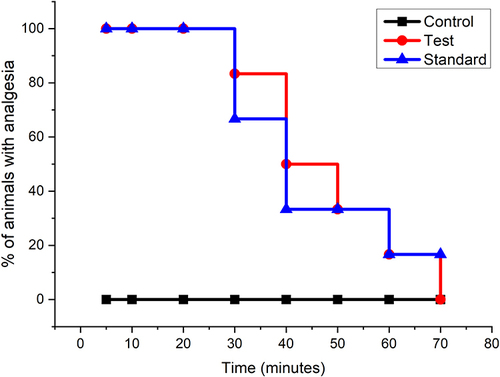
Table 3 Effect of Injection Harsha 22 on the Hematological Parameters in Experimental Groups
Table 4 Effect of Injection Harsha 22 on the Serum Lipid Profile
Table 5 Effect of Injection Harsha 22 on the Serological Parameters in Experimental Groups