Figures & data
Figure 1 (A) Body mass: The weekly body mass measurements during the experimental period. (B) Fasting plasma glucose: The weekly fasting plasma glucose measurements during the experimental period. i.p 40mg/kg of streptozotocin injected on day 42 for all groups except the normal control (NC). (C) Oral glucose tolerance: The area under the curve (AUC, measured in mmol/l×min) calculated values from the oral glucose tolerance curves after an oral bolus of 2g/kg of glucose solution.
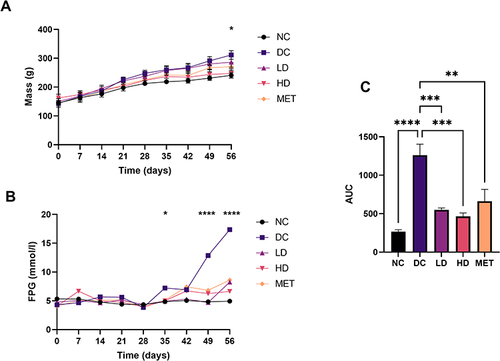
Figure 2 Typical electrocardiogram tracings obtained at the end of the experimental period of the (A) NC group, (B) DC group, (C) LD group, (D) HD group and (E) MET group. Dotted lines indicate where measurements were taken by the LabChart™ software.
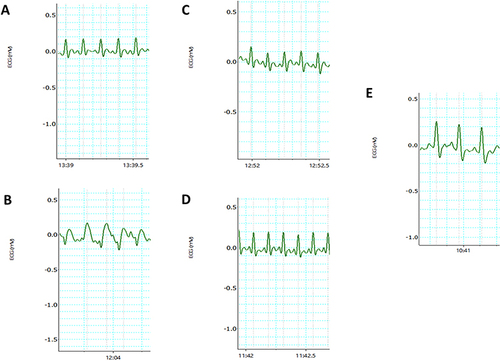
Figure 3 (A) QT interval duration at the end of the experiment. (B) QTc duration at the end of the experiment. (C) QRS interval at the end of the experiment. Values are expressed as mean ± SEM. n = 5 rats in each group (*p < 0.05, **p < 0.01).
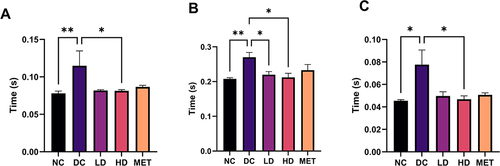
Table 1 Other Electrocardiogram Measurements at the End of the Experimental Period
Table 2 Heart Mass and Indices at the End of the Experimental Period
Figure 4 Paracardial adipose mass between experimental groups. Values are expressed as mean ± SEM. n = 5 rats in each group, (*p < 0.05, **p < 0.01, one-way ANOVA).
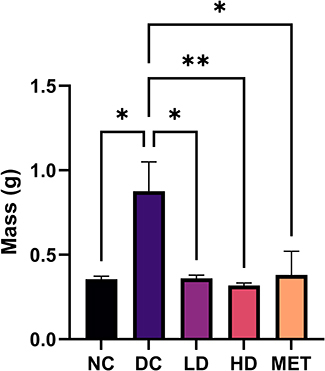
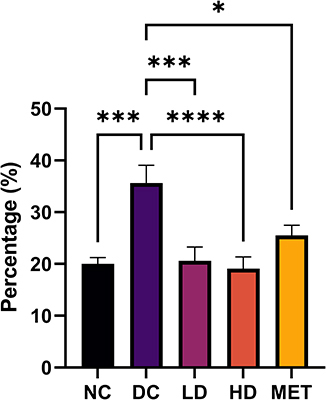
Figure 5 The percentage fibrotic area of the experimental groups calculated using longitudinal sections of the left ventricle, (*p < 0.05, ***p < 0.001, **** p < 0.0001, one-way ANOVA).