Figures & data
Table 1 Screening test results for phytochemicals found in khat
Figure 1 Body weights of experimental animals.
Notes: Body weights of experimental animals (grams), shown as mean ± standard error of the mean. All animals showed a modest weight gain. There was no statistical difference in body weight between the treatment groups at the beginning of the experiment and at 28 days of treatment. However, on day 24, there was a trend towards a significant difference in body weights (P = 0.059) which persisted to day 28 (P = 0.062).
Abbreviation: EtOH, ethanol.
Abbreviation: EtOH, ethanol.
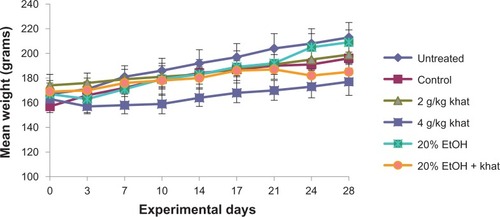
Figure 2 Blood cell counts of male rats after 28 days of treatment.
Notes: (A) White blood cell counts of male rats after 28 days of 2 g/kg khat, 4 g/kg khat, 20% ethanol, 20% ethanol plus khat, control, and no treatment, shown as mean ± standard error of the mean. There was no statistical difference between the treatment groups. (B) Red blood cell counts of male rats after 28 days of 2 g/kg khat, 4 g/kg khat, 20% ethanol, 20% ethanol plus khat, control, and no treatment. There was no statistical difference between the treatment groups. (C) Platelet counts of male rats after 28 days of 2 g/kg khat, 4 g/kg khat, 20% ethanol, 20% ethanol plus khat, control, and no treatment. Ethanol treatment significantly reduced the platelet count compared to 2 g/kg khat treatment and control and untreated rats; aP < 0.05, comparing 20% ethanol and untreated animals; bP < 0.05, comparing 20% ethanol and control animals; *P < 0.05, comparing 20% ethanol and 2 g/kg khat. (D) Red blood cell distribution width of different treatments at 28 days of 2 g/kg khat, 4 g/kg khat, 20% ethanol, 20% ethanol plus khat, control, and no treatment. There was no statistical difference between the treatment groups.
Abbreviations: kh, khat; EtOH, ethanol.
Abbreviations: kh, khat; EtOH, ethanol.
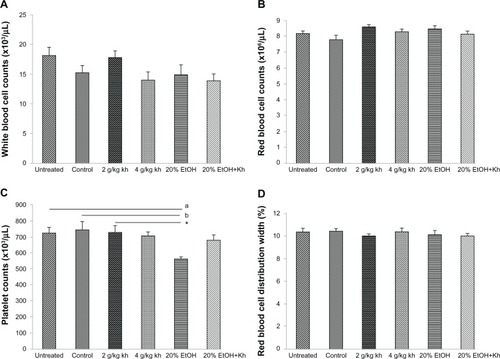
Figure 3 Mean corpuscular values of male rats after 28 days of treatment.
Notes: (A) Mean corpuscular volume of male rats after 28 days of 2 g/kg khat, 4 g/kg khat, 20% ethanol, 20% ethanol plus khat, control, and no treatment, shown as mean ± standard error of the mean. There was no statistical difference between the treatment groups. (B) Mean corpuscular hemoglobin of male rats after 28 days of 2 g/kg khat, 4 g/kg khat, 20% ethanol, 20% ethanol plus khat, control, and no treatment. There was no statistical difference between the treatment groups. (C) Mean corpuscular hemoglobin concentration of male rats after 28 days of 2 g/kg khat, 4 g/kg khat, 20% ethanol, 20% ethanol plus khat, control, and no treatment. There was no statistical difference between the treatment groups. (D) Mean platelet volume of male rats after 28 days of 2 g/kg khat, 4 g/kg khat, 20% ethanol, 20% ethanol plus khat, control, and no treatment. There was no statistical difference between the treatment groups.
Abbreviations: kh, khat; EtOH, ethanol.
Abbreviations: kh, khat; EtOH, ethanol.
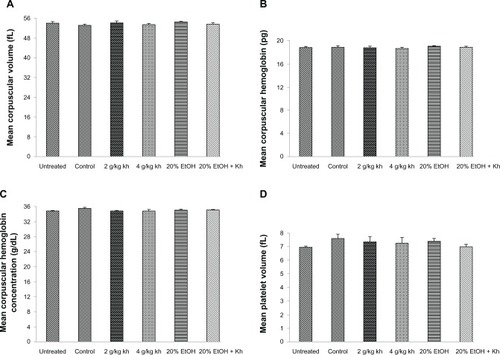
Figure 4 Hemoglobin and hematocrit levels of male rats after 28 days of treatment.
Notes: (A) Hemoglobin levels of male rats after 28 days of 2 g/kg khat, 4 g/kg khat, 20% ethanol, 20% ethanol plus khat, control, and no treatment, shown as mean ± standard error of the mean. Both 2 g/kg khat and 20% ethanol significantly increased Hb compared to control treatment. *P < 0.05 comparing 2 g/kg khat to control; **P < 0.05 comparing 20% ethanol to control. (B) Hematocrit values of male rats after 28 days of 2 g/kg khat, 4 g/kg khat, 20% ethanol, 20% ethanol plus khat, control, and no treatment. 2 g/kg khat significantly increased hematocrit compared to control treatment. ***P < 0.05 comparing 2 g/kg khat and control.
Abbreviations: kh, khat; EtOH, ethanol.
Abbreviations: kh, khat; EtOH, ethanol.
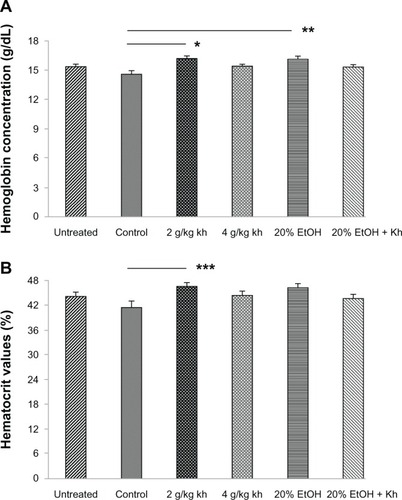
Figure 5 Serum enzyme levels of male rats after 28 days of treatment.
Notes: (A) Serum amylase of male rats after 28 days of 2 g/kg khat, 4 g/kg khat, 20% ethanol, 20% ethanol plus khat, control, and no treatment, shown as mean ± standard error of the mean. There was no statistical difference between the treatment groups. (B) Serum alkaline phosphatase of male rats after 28 days of 2 g/kg khat, 4 g/kg khat, 20% ethanol, 20% ethanol plus khat, control, and no treatment. There was no statistical difference between the treatment groups. (C) Serum aspartate aminotransferase of male rats after 28 days of 2 g/kg khat, 4 g/kg khat, 20% ethanol, 20% ethanol plus khat, control, and no treatment. There was no statistical difference between the treatment groups although there was a trend towards a significant ethanol effect (P = 0.061). (D) Serum alanine aminotransferase of male rats after 28 days of 2 g/kg khat, 4 g/kg khat, 20% ethanol, 20% ethanol plus khat, control, and no treatment. There was no statistical difference between the treatment groups. DGKC is a method for the determination of alkaline phosphatase (ALP) from the German Society of Clinical Chemistry [Deutsche Gesellschaft fur Klinische Chemie].
Abbreviations: ALP, alkaline phosphatase; GOT, glutamic oxaloacetic transaminase; AST, aspartate aminotransferase; GPT, glutamic pyruvate transaminase; ALT, alanine aminotransferase; kh, khat; EtOH, ethanol; DGKC, [Deutsche Gesellschaft fur Klinische Chemie]; German Society of Clinical Chemistry method.
Abbreviations: ALP, alkaline phosphatase; GOT, glutamic oxaloacetic transaminase; AST, aspartate aminotransferase; GPT, glutamic pyruvate transaminase; ALT, alanine aminotransferase; kh, khat; EtOH, ethanol; DGKC, [Deutsche Gesellschaft fur Klinische Chemie]; German Society of Clinical Chemistry method.
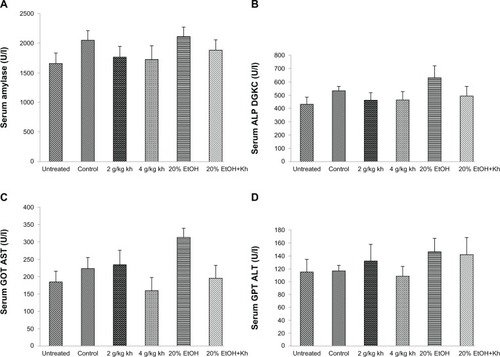
Figure 6 Serum creatinine, albumin and lipoprotein levels of male rats after 28 days of treatment.
Notes: (A) Serum creatinine of male rats after 28 days of 2 g/kg khat, 4 g/kg khat, 20% ethanol, 20% ethanol plus khat, control, and no treatment, shown as mean ± standard error of the mean. There was no statistical difference between the treatment groups. (B) Serum albumin of male rats after 28 days of 2 g/kg khat, 4 g/kg khat, 20% ethanol, 20% ethanol plus khat, control, and no treatment. There was no statistical difference between the treatment groups. (C) Serum high density lipoprotein of male rats after 28 days of 2 g/kg khat, 4 g/kg khat, 20% ethanol, 20% ethanol plus khat, control, and no treatment. There was no statistical difference between the treatment groups. (D) Serum low density lipoprotein of male rats after 28 days of 2 g/kg khat, 4 g/kg khat, 20% ethanol, 20% ethanol plus khat, control, and no treatment. There was no statistical difference between the treatment groups.
Abbreviations: kh, khat; EtOH, ethanol; LDL, low density lipoproteins; HDL, high density lipoproteins.
Abbreviations: kh, khat; EtOH, ethanol; LDL, low density lipoproteins; HDL, high density lipoproteins.
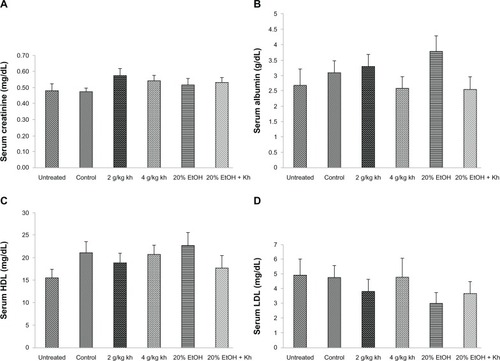
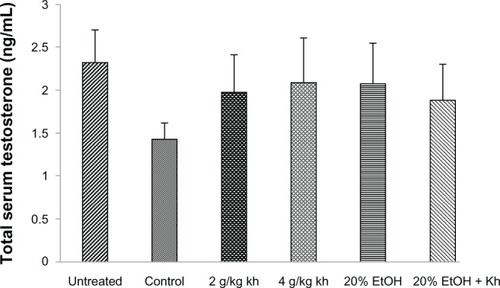
Figure 7 Total serum testosterone in male rats after 28 days of treatment.
Notes: Serum testosterone of male rats after 28 days of 2 g/kg khat, 4 g/kg khat, 20% ethanol, 20% ethanol plus khat, control, and no treatment, shown as mean ± standard error of the mean. There was no statistical difference between the treatment groups.
Abbreviations: kh, khat; EtOH, ethanol.
Abbreviations: kh, khat; EtOH, ethanol.