
Figures & data
Figure 1 Study flow diagram.
Abbreviations: ICD-10, International Classification of Disease; ICD-O-3, International Classification of Diseases for Oncology; NOS, not otherwise specified.
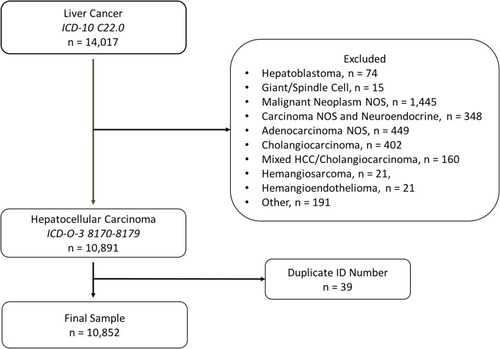
Table 1 Baseline Characteristics Of The Overall Sample And The Sample Stratified By Race
Table 2 Selected Population Characteristics Of The Overall Sample And The Sample Stratified By Race
Figure 2 Geographic distribution of HCC cases throughout Florida, unadjusted for population density. Regions in red have the highest raw number of HCC cases.
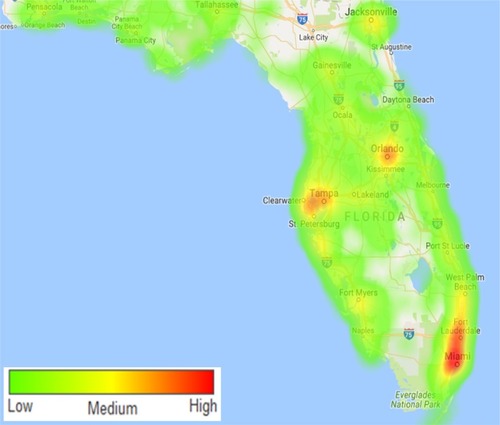
Figure 3 Kaplan–Meier curves (A) stratified by race/ethnicity and (B) stratified by race/ethnicity and adjusted for gender, age at diagnosis, insurance type, SEER Summary Tumor Stage, surgery type, and treatment status.
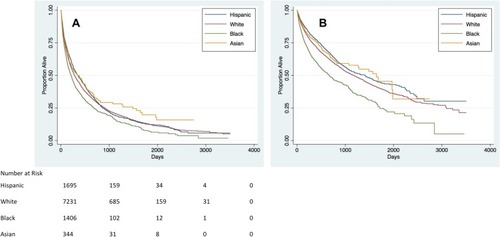
Table 3 Factors Associated With Survival On Univariate And Multivariate Analysis