Figures & data
Table 1 Nucleotide Sequences of Primers Used for PCR
Figure 1 PKM2 plays an important role in HCC cells. (A) The expression of PKM2 mRNA was detected by RT-PCR. The data are expressed as the mean ± SD (n = 3, *P < 0.05 vs LO2). (B) Western blotting was used to determine the expression of PKM2 protein. β-actin was used as a loading control. The data are expressed as the mean ± SD (n = 3, *P < 0.05 vs LO2). (C) The expression of PKM2 mRNA in LM3 and SMMC-7721 cells was detected by RT-PCR after PKM2-OE or PKM2-shRNA use. Data are shown as the mean ± SD (n = 3, *P < 0.05 for PKM2-OE vs EV or for PKM2-shRNA vs scramble). (D) Expression of PKM2 protein in LM3 and SMMC-7721 cells was determined by Western blotting after PKM2-OE or PKM2-shRNA use. Data are shown as the mean ± SD (n = 3, *P < 0.05 for PKM2-OE vs EV or for PKM2-shRNA vs scramble). (E) CCK8 was used to detect cell viability after PKM2-OE or PKM2-shRNA use. The data are expressed as the mean ± SD (n = 3, *P < 0.05 for PKM2-OE vs EV; #P < 0.05 for PKM2-shRNA vs scramble). (F and G) Apoptosis of LM3 and SMMC-7721 cells was determined by Hoechst 33342 and flow cytometry after PKM2-OE or PKM2-shRNA use. (H) Expression of Bcl-2, Bax, cleaved-caspase 3, and cleaved-caspase 9 protein was detected by Western blotting. (I) LM3 and SMMC-7721 cells were cultured for 48 h. Glucose uptake and relative lactate production were analyzed. The data are shown as the mean ± SD (n = 3, *P < 0.05 for PKM2-OE vs EV; #P < 0.05 for PKM2-shRNA vs scramble).
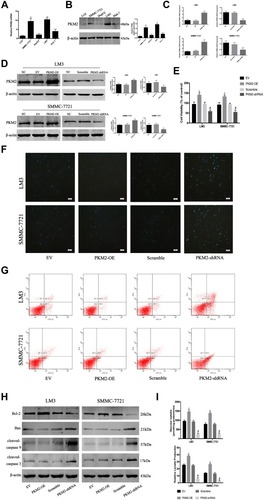
Figure 2 The anti-tumor effects of SK in HCC cells. (A) HCC cells (SMMC-7721 and LM3) and normal liver cells (LO2) were treated with SK (0–5 μM) for 48 h and cell viability was determined by CCK8 assays. HCC cells and normal liver cells were treated with SK (3 μM) for 24–96 h and cell viability was determined by CCK8 assays (n = 3). (B) Western blotting was used to detect the expression of G0/G1 phase-related proteins in LM3 and SMMC-7721 cells treated with SK (3 μM) for 24 h. Data are expressed as the mean ± SD (n = 3, *P < 0.05 for SK [3 μM] vs NC). (C) Cell cycle analysis of HCC cells treated with SK for 24 h. Proportion of cells in different phases of the cell cycle is shown (n = 3, *P < 0.05 for SK [1 μM] vs NC, #P < 0.05 for SK [2 μM] vs SK [1 μM], and +P < 0.05 for SK [3 μM] vs SK [2 μM] in G0/G1 phase). (D and E) Apoptosis of LM3 and SMMC-7721 was detected by Hoechst 33342 and flow cytometry (magnification 200 ×). The data are expressed as the mean ± SD (n = 3, *P < 0.05 for SK [1 μM] vs NC, #P < 0.05 for SK [2 μM] vs SK [1 μM], and +P < 0.05 for SK [3 μM] vs SK [2 μM]). (F) Expression of cleaved-caspase 3, cleaved-caspase 9, and PARP protein was detected by Western blotting. β-actin was used as a loading control. The gray values were calculated. The data are expressed as the mean ± SD (n = 3, *P < 0.05 for SK [1 μM] vs NC, #P < 0.05 for SK [2 μM] vs SK [1 μM], and +P < 0.05 for SK [3 μM] vs SK [2 μM]). (G) HCC cells (LM3 and SMMC-7721) and normal liver cells (LO2) were treated with SK for 48 h. Glucose uptake and relative lactate production were analyzed. The data are expressed as the mean ± SD (n = 3, *P < 0.05 for SK [1 μM] vs NC, #P < 0.05 for SK [2 μM] vs SK [1 μM], and +P < 0.05 for SK [3 μM] vs SK [2 μM]).
![Figure 2 The anti-tumor effects of SK in HCC cells. (A) HCC cells (SMMC-7721 and LM3) and normal liver cells (LO2) were treated with SK (0–5 μM) for 48 h and cell viability was determined by CCK8 assays. HCC cells and normal liver cells were treated with SK (3 μM) for 24–96 h and cell viability was determined by CCK8 assays (n = 3). (B) Western blotting was used to detect the expression of G0/G1 phase-related proteins in LM3 and SMMC-7721 cells treated with SK (3 μM) for 24 h. Data are expressed as the mean ± SD (n = 3, *P < 0.05 for SK [3 μM] vs NC). (C) Cell cycle analysis of HCC cells treated with SK for 24 h. Proportion of cells in different phases of the cell cycle is shown (n = 3, *P < 0.05 for SK [1 μM] vs NC, #P < 0.05 for SK [2 μM] vs SK [1 μM], and +P < 0.05 for SK [3 μM] vs SK [2 μM] in G0/G1 phase). (D and E) Apoptosis of LM3 and SMMC-7721 was detected by Hoechst 33342 and flow cytometry (magnification 200 ×). The data are expressed as the mean ± SD (n = 3, *P < 0.05 for SK [1 μM] vs NC, #P < 0.05 for SK [2 μM] vs SK [1 μM], and +P < 0.05 for SK [3 μM] vs SK [2 μM]). (F) Expression of cleaved-caspase 3, cleaved-caspase 9, and PARP protein was detected by Western blotting. β-actin was used as a loading control. The gray values were calculated. The data are expressed as the mean ± SD (n = 3, *P < 0.05 for SK [1 μM] vs NC, #P < 0.05 for SK [2 μM] vs SK [1 μM], and +P < 0.05 for SK [3 μM] vs SK [2 μM]). (G) HCC cells (LM3 and SMMC-7721) and normal liver cells (LO2) were treated with SK for 48 h. Glucose uptake and relative lactate production were analyzed. The data are expressed as the mean ± SD (n = 3, *P < 0.05 for SK [1 μM] vs NC, #P < 0.05 for SK [2 μM] vs SK [1 μM], and +P < 0.05 for SK [3 μM] vs SK [2 μM]).](/cms/asset/84e88562-4943-48c2-9eed-bd4891b790bd/djhc_a_237614_f0002_c.jpg)
Figure 3 SK exerts anti-tumor effects by regulating PKM2 in HCC cells. (A) RT-PCR analysis of the effects of shikonin (SK) (3 μM) on mRNA expression of genes related to glycolysis in HCC cells. The data are shown as the mean ± SD (n = 3, **P< 0.01 for SK [3 μM] vs NC). (B) Western blotting analysis of PKM2 in LM3 and SMMC-7721 cells treated with SK (0, 1, 2, and 3 μM) for 48 h. The gray values were calculated (n = 3, *P < 0.05 for SK [1 μM] vs NC, #P < 0.05 for SK [2 μM] vs SK [1 μM], +P < 0.05 for SK [3 μM] vs SK [2 μM]). (C) CCK8 was used to determine cell viability. Data are shown as the mean ± SD (n = 3, *P < 0.05 for SK vs NC, #P < 0.05 for PKM2-OE + SK vs SK, +P < 0.05 for PKM2-shRNA + SK vs SK). (D) Western blotting analysis of cyclin D1 in LM3 and SMMC-7721 cells treated with SK. (E) Apoptosis of LM3 and SMMC-7721 cells was detected by flow cytometry (n = 3, *P < 0.05 for SK vs NC, #P < 0.05 for PKM2-OE + SK vs SK, +P < 0.05 for PKM2-shRNA + SK vs SK). (F) Expressions of Bcl-2, Bax, cleaved-caspase 9, cleaved-caspase 3, and cyto C proteins in LM3 and SMMC-7721 cells were determined by Western blotting. β-actin was used as a loading control. The gray values were calculated (n = 3, *P < 0.05 for SK vs NC, #P < 0.05 for PKM2-OE + SK vs SK, +P < 0.05 for PKM2-shRNA + SK vs SK). (G) Glucose uptake and relative lactate production were analyzed. The data are expressed as the mean ± SD (n = 3, *P < 0.05 for SK vs NC, #P < 0.05 for PKM2-OE + SK vs SK, +P < 0.05 for PKM2-shRNA + SK vs SK).
![Figure 3 SK exerts anti-tumor effects by regulating PKM2 in HCC cells. (A) RT-PCR analysis of the effects of shikonin (SK) (3 μM) on mRNA expression of genes related to glycolysis in HCC cells. The data are shown as the mean ± SD (n = 3, **P< 0.01 for SK [3 μM] vs NC). (B) Western blotting analysis of PKM2 in LM3 and SMMC-7721 cells treated with SK (0, 1, 2, and 3 μM) for 48 h. The gray values were calculated (n = 3, *P < 0.05 for SK [1 μM] vs NC, #P < 0.05 for SK [2 μM] vs SK [1 μM], +P < 0.05 for SK [3 μM] vs SK [2 μM]). (C) CCK8 was used to determine cell viability. Data are shown as the mean ± SD (n = 3, *P < 0.05 for SK vs NC, #P < 0.05 for PKM2-OE + SK vs SK, +P < 0.05 for PKM2-shRNA + SK vs SK). (D) Western blotting analysis of cyclin D1 in LM3 and SMMC-7721 cells treated with SK. (E) Apoptosis of LM3 and SMMC-7721 cells was detected by flow cytometry (n = 3, *P < 0.05 for SK vs NC, #P < 0.05 for PKM2-OE + SK vs SK, +P < 0.05 for PKM2-shRNA + SK vs SK). (F) Expressions of Bcl-2, Bax, cleaved-caspase 9, cleaved-caspase 3, and cyto C proteins in LM3 and SMMC-7721 cells were determined by Western blotting. β-actin was used as a loading control. The gray values were calculated (n = 3, *P < 0.05 for SK vs NC, #P < 0.05 for PKM2-OE + SK vs SK, +P < 0.05 for PKM2-shRNA + SK vs SK). (G) Glucose uptake and relative lactate production were analyzed. The data are expressed as the mean ± SD (n = 3, *P < 0.05 for SK vs NC, #P < 0.05 for PKM2-OE + SK vs SK, +P < 0.05 for PKM2-shRNA + SK vs SK).](/cms/asset/25c46c7d-cd02-4c44-a664-527a445960a6/djhc_a_237614_f0003_c.jpg)
Figure 4 Effects of SK combined with sorafenib in vitro and in vivo. (A and B) LM3 and SMMC-7721 cells were treated with sorafenib combined with SK for 48 h. CCK8 assays were used to determine cell viability. Data are expressed as the mean ± SD. The combination index (CI) < 1 indicates synergistic effects. (C) LM3 and SMMC-7721 cells were treated with sorafenib (0–10 μM) for 48 h and cell viability was assessed by CCK8 assays. Data are expressed as the mean ± SD. (D) Tumors on day 24 (n = 2, *P < 0.05 for SK5 or S10 vs SK5 + S10). (E and F) Changes in mouse weight and tumor volume were recorded at the indicated time points. (G) H&E staining in tumor sections indicated levels of necrosis (magnification 200 ×, n = 3, *P < 0.05 for SK5 or S10 vs SK5 + S10). (H) IHC staining in tumor sections indicated the expression of PKM2 (magnification 200 ×).
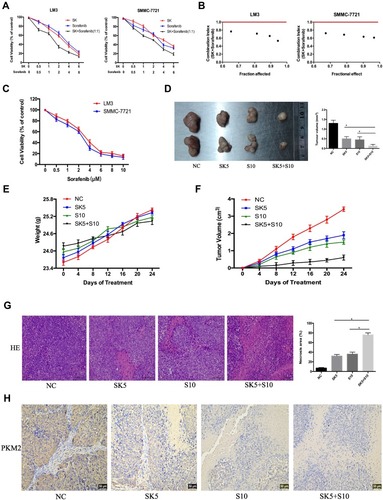
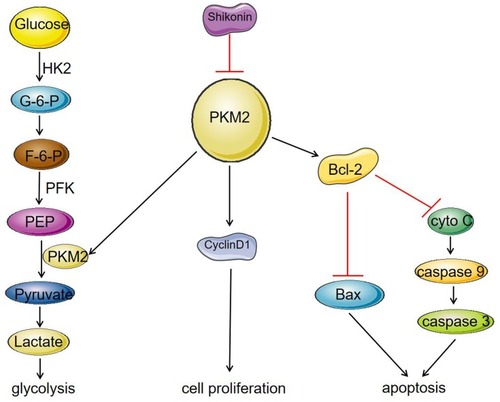
Figure 5 Mechanism of SK on inhibition of glycolysis and proliferation and induction of apoptosis in HCC cell lines. SK significantly reduced the expression of PKM2, and inhibited the expression of cyclinD1, thereby inhibiting the proliferation of HCC cells. On the other hand, a decrease in PKM2 expression affected the binding of PKM2 to Bcl-2, resulting in a decrease in the anti-apoptotic protein Bcl-2, which led to increase in the protein Bax, caspase 9, and caspase 3, thereby promoting apoptosis of HCC cells. As a rate-limiting enzyme in the glycolysis process, PKM2 can catalyze the production of pyruvate by phosphoenolpyruvate (PEP). The decrease in PKM2 affected HCC cell energy metabolism and inhibited the process of glycolysis.