
Figures & data
Figure 1 Diagram of study flow.
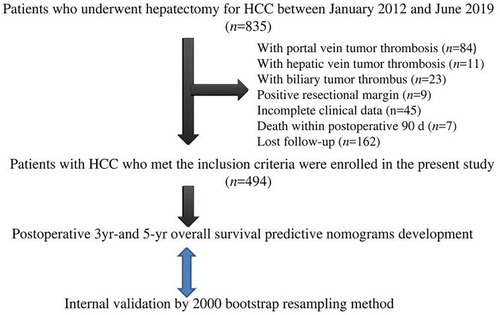
Table 1 Patient Characteristics and Univariate Results for 3- and 5-Year Postoperative Overall Survival
Table 2 Comparison of Recurrence Sites and Treatments Between ER and LR
Table 3 Median Post-Recurrence Survival of Patients with Early Recurrence After Recurrence Management
Table 4 Comparison of Post-Recurrence Survival After Early Recurrence (Log Rank Test)
Table 5 Median Post-Recurrence Survival of Patients with Late Recurrence After Recurrence Management
Table 6 Comparison of Post-Recurrence Survival After Late Recurrence (Log Rank Test)
Table 7 Multivariate Results for Postoperative 3-Year Overall Survival
Table 8 Multivariate Results for Postoperative 5-Year Overall Survival
Figure 2 (A) Nomogram for the assessment of 3-year overall survival (OS) of patients with hepatocellular carcinoma who have undergone curative hepatectomy. Individual patient values are placed on the variable axes, and a line is drawn upward to determine the number of points that each variable value is worth. The sum of these numbers is placed on the total points axis, and a line is drawn downward to the survival axes to determine the likelihood of 3-year OS. γ-GGT, γ-glutamyl transferase; HKLC, Hong Kong Liver Cancer. Recurrence managements: 1 = re-resection, 2 = microwave ablation, 3 = transarterial chemoembolization, 4 = targeted therapy, 5 = radiation therapy, 6 = best supportive care. (B) The area under the time-dependent receiver operating characteristic (ROC) curve (AUC) of the nomogram for 3-year OS. (C) Internal validation by bootstrap analysis. D, development; V, validation. (D) Calibration plot showing the relationships between predicted and actual probabilities based on the nomogram. The x and y axes represent the nomogram-predicted and actual probabilities, respectively, of 3-year death. Red solid circles represent the curve fitting line, and blue hollow circles represent nomogram-predicted probabilities with 95% confidence intervals. The green reference line indicates the ideal nomogram, in which actual and predicted probabilities are perfectly identical. The calibration curve shows good prognostic performance. The Hosmer-Lemeshow chi-squared value for calibration was 8.678 (P = 0.370).
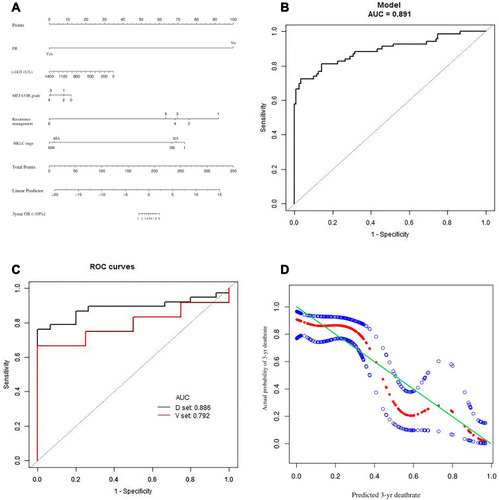
Figure 3 (A) Nomogram for the assessment of 5-year overall survival (OS) of patients with hepatocellular carcinoma who have undergone curative hepatectomy. The nomogram is used as described for . (a). γ-GGT, γ-glutamyl transferase; LR, late recurrence. Extent of hepatectomy: 0 = wedge resection, 1 = one Couinaud segment, 2 = two Couinaud segments, 3 = 3 Couinaud segments, 4 = ≥4 Couinaud segments. Recurrence management: 0 = no recurrence, 1 = re-resection; 2 = microwave ablation, 3 = transarterial chemoembolization, 4 = supportive care. (B) The area under the time-dependent receiver operating characteristic curve (AUC) of the nomogram for 5-year OS. (C) Internal validation by bootstrap analysis. ROC, receiver operating characteristic; D, development; V, validation. (D) Calibration plot showing the relationships between predicted and actual probabilities based on the nomogram. The x and y axes represent the nomogram-predicted and actual probabilities, respectively, of 5-year death. Red solid circles represent the curve fitting line, and blue hollow circles represent nomogram-predicted probabilities with 95% confidence intervals. The green reference line indicates the ideal nomogram, in which actual and predicted probabilities are perfectly identical. The calibration curve shows good prognostic performance. The Hosmer-Lemeshow chi-squared value for calibration was 5.453 (P = 0.708).
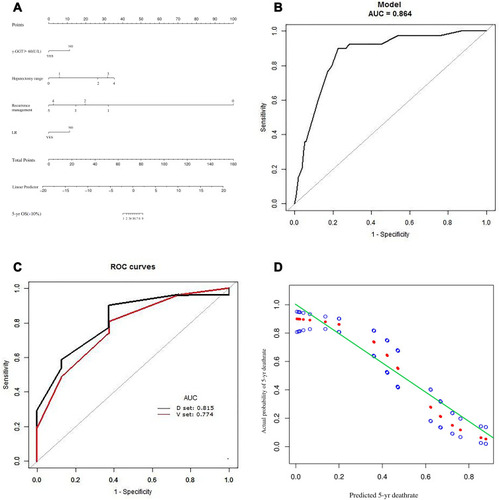
Figure 4 Areas under the time-dependent receiver operating characteristic curves (AUCs) for the three representative hepatocellular carcinoma staging systems for the prediction of 3-year overall survival. (A) 8th AJCC-TNM system, (B) BCLC system, and (C) HKLC system.
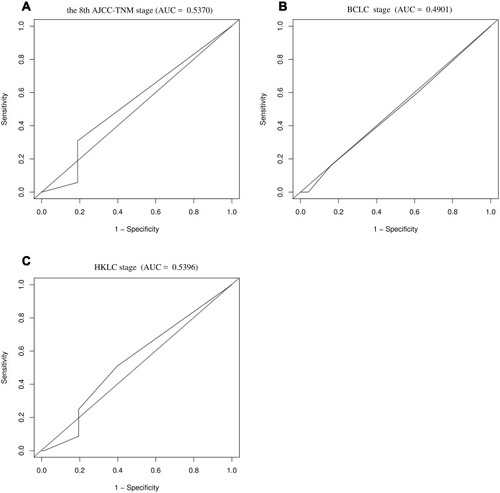
Figure 5 Areas under the time-dependent receiver operating characteristic curves (AUCs) for the three representative hepatocellular carcinoma staging systems for the prediction of 5-year overall survival. (A) 8th AJCC-TNM system, (B) BCLC system, and (C) HKLC system.
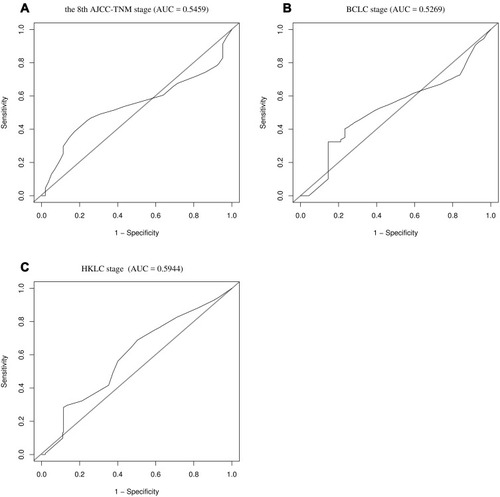
Table 9 Published Nomograms for the Assessment of Overall Survival After Curative Hepatectomy