
Figures & data
Table 1 Characteristics of the Study Subjects Used to Evaluate the GALAD Model and Construct the GAAP Model
Table 2 Characteristics of Patients Used to Test the GAAP Model
Figure 1 Serum AFP, PIVKA-II, and AFP-L3% in HCC and non-HCC groups. Comparison of AFP (A), PIVKA-II (B), and AFP-L3% (D) among HCC, Cirrhosis, Hepatitis, OMT, and HC groups. Comparison of PIVKA-II (C) among ICC, HCC, liver metastasis, and HCs. Comparison of AFP (E) and PIVKA-II (F) among HBV-related liver disease and HCV-related liver disease groups. The three horizontal bars in A, B, D, E, and F represent median with interquartile range values. For AFP and PIVKA-II, Kruskal–wallis H-tests were used for comparisons among groups; post hoc Dunn’s Multiple Comparison tests were performed for pairwise comparisons. For AFP-L3%, Chi-square tests were performed. ***P <0.001, **P <0.01, *P <0.05, ns P>0.05.
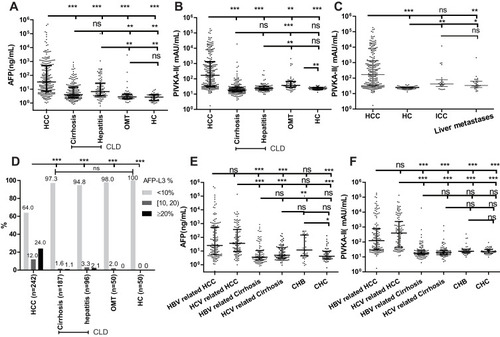
Figure 2 ROC curves comparing performance between GALAD, GALAD-C, GAAP, individual biomarkers, and combinations for discriminating HCC from CLD (A), HCC from Cirrhosis (B), HCC from Hepatitis (C), HCC within Milan Criteria from CLD (D), HCC (maximum diameter < 5 cm) from CLD (E), HCC (maximum diameter ≥ 5cm) from CLD (F), HCC from CLD, HCV etiology (G), HCC from CLD, HBV etiology (H), and comparisons between HCV and HBV etiology for the three models (I). HCC, hepatocellular carcinoma; CLD, chronic liver disease. In the marker combinations, “+” means “OR”, and the cutoffs were 28.23 mAU/mL, 12.62 ng/mL, and 1.744% for PIVKA-II, AFP, and AFP-L3%, respectively.
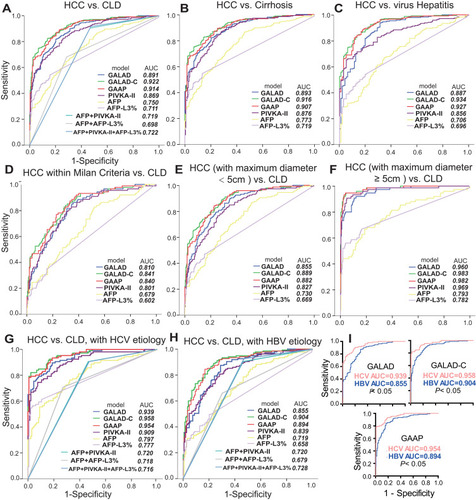
Table 3 ROC Curve Analysis of Serum Biomarkers Alone and Combination, GALAD-C and GAAP for Discriminating HCC (n=242) and CLD (n=283)