Figures & data
Table 1 Clinical Characteristics of HCC Patients in Two Cohorts
Figure 1 The design of this study. A total of 231 HCC patients from Mengchao Hepatobiliary Hospital of Fujian Medical University were collected and distributed into the training cohort (n=61) and the validation cohort (n=191). Among these recruited patients, 21 patients were shared by both of the cohorts. HCC and non-tumor tissues from the training cohort were analyzed by RNA sequencing, and applied to establish the prognostic model. Another batch of samples from the validation cohort were measured by qRT-PCR to confirm the expressions of prognostic evaluation lncRNAs and assess the performance of the model.
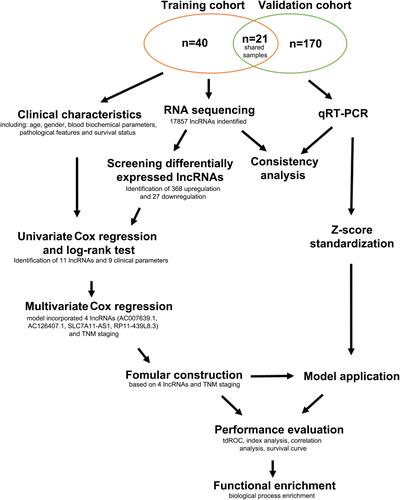
Figure 2 Volcano plot showing the distribution of DE-LncRNAs. Red dots represent upregulated lncRNAs and green dots represent downregulated lncRNAs in HCC compared to non-tumor tissues.
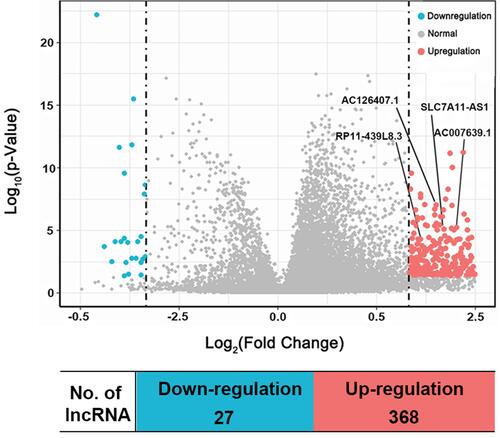
Table 2 The Details of Four lncRNAs and TNM Staging Screened Picked Up by Multivariate Cox Regression Analysis
Figure 3 Survival curves and distributions plot of HCC patients in training or validation cohorts. (A and B) Kaplan-Meier survival curve of OS between high-risk and low-risk groups in the training cohort (A) and in the validation cohort (B). (C and D) Kaplan-Meier survival curve of RFS between high-risk and low-risk groups in the training cohort (C) and in the validation cohort (D). (E and F) The distributions of HCC patients according to the risk score and survival status in the training cohort (E) and in the validation cohort (F). The patients in the training cohort were divided into low-risk group and high-risk group depending on the median score. However, optimum cut-off calculated by tdROC curve was used for distributing the patients from the validation cohort into low-risk and high-risk groups.
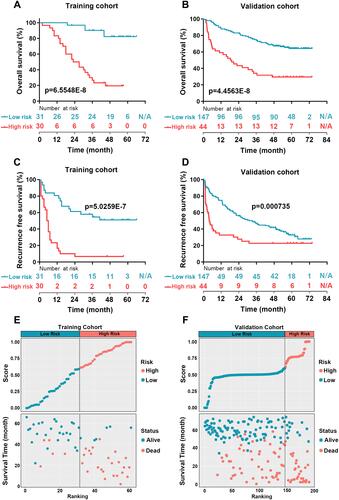
Figure 4 Performance assessment of prognostic evaluation model for predicting OS and RFS in the training and the validation cohorts. (A and B) Time-dependent receiver operating characteristic (tdROC) curves of the prognostic evaluation model in predicting OS in the training cohort (A) or in the validation cohort (B). (C and D) tdROC curves of the prognostic evaluation model in predicting RFS in the training cohort (C) or in the validation cohort (D), (E) Harrell’s c-index and Gönen & Heller’s K analysis of the prognostic evaluation model in predicting OS and RFS in both of the cohorts.
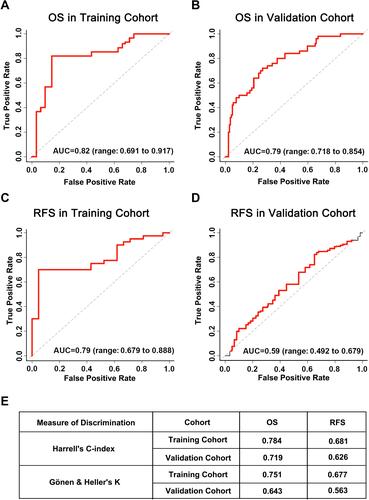
Table 3 Comparison of Clinical Variables between HCC Patients with Low and High Prognostic Value in Testing Cohort
Figure 5 Correlation analysis of risk score, clinicopathological features, and survival. (A–F) HCC tissues with vascular invasion (A), tumor embolus (B), bigger tumor size (≥5cm) (C), higher AFP level (≥400 ng/mL) (D), more advanced BCLC grading (stage B or stage C) (E), but not Edmondson classification (F), displayed significantly higher risk score, **p<0.01, ***p<0.001, ****p<0.0001, NS, non-significant. (G–I) Kaplan–Meier curves for overall survival between HCC patients with high-risk score and low-risk score in the validation cohort, according to different clinical features: vascular invasion (G), tumor embolus (H), and BCLC staging (I), all p<0.05.
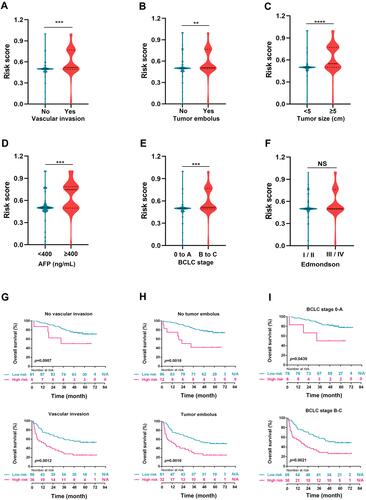
Figure 6 GSEA analysis of significantly enriched genes sets in the comparison between high-risk and low-risk groups in the training cohort. Differentially expressed gene sets in the comparison between high-risk and low-risk groups were enriched in regulation of innate immune response (A), negative regulation of immune system process (B), autophagy (C), and response to radiation (D). All p<0.01 and adjusted p<0.05.
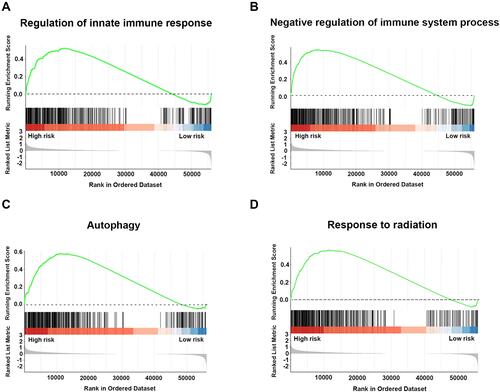
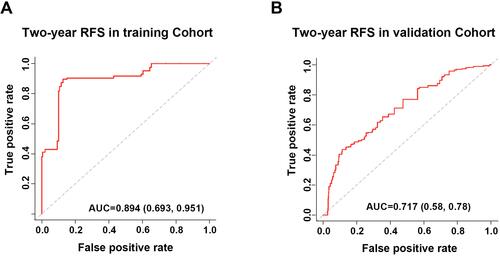
Figure 7 tdROC curves of the prognostic evaluation model in predicting 2-year RFS in the training and validation cohorts. (A) tdROC curve of 2-year RFS in the training cohort. (B) tdROC curve of 2-year RFS in the validation cohort.