Figures & data
Table 1 The Difference in Clinical Features Between Training and Validation Groups
Figure 1 The predictive model setup procedure. After grouping (A), patient characteristics, including clinical, laboratory, and general CT features, were collected (B). The ROI of the NC-CT image was drawn and used to extract radiomic features (C). A CT radiomics model and a compound model were constructed and validated (D). Different models were evaluated by ROC curve and survival analysis to predict TACE response and prognosis in HCC patients (E).
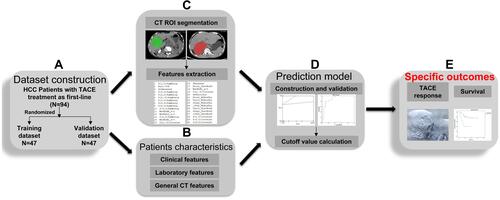
Table 2 Logistic Analysis of Clinical Features for Evaluation of TACE Response in the Training Group
Figure 2 ROC curve of TACE short-term response in HCC patients. (A) Training group. (B) Validation group.
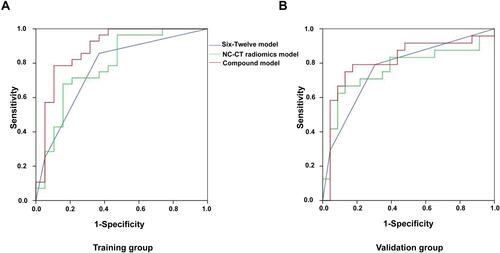
Figure 3 Kaplan–Meier analysis of overall survival in different models. (A and C) Compound model with two groups. The cutoff value of the two groups was 2.7. (B and D) Six-and-twelve grade model with three groups: Group 1 was ≤6, group 2 was >6 and <12, and group 3 was ≥12.
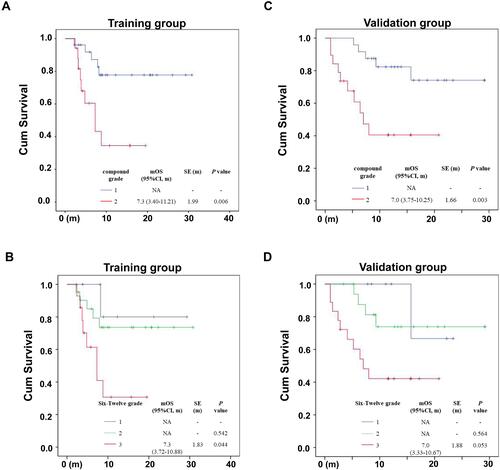
Figure 4 The radiomics nomogram of TACE-nonresponse risk in our compound model. The radiomics signature was calculated from four radiomic features.
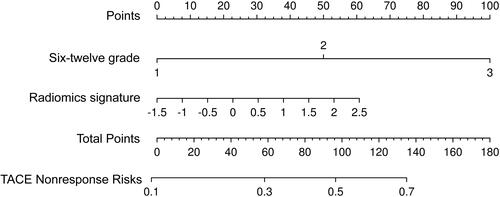
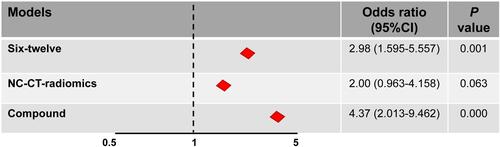
Figure 5 Forest plot of three models using Cox regression.