Figures & data
Table 1 Patient and Treatment Characteristics (n=93)
Table 2 Dynamic Changes of Complete Blood Counts and Immune Parameters Pre- and Post-SBRT
Table 3 Prognostic Factors on Overall Survival by Cox Proportional-Hazards Model
Figure 1 Survival groups based on pre-SBRT NLR and dNLR. Kaplan–Meier curve of overall survival (A) according to pre-SBRT NLR and subgroup comparisons among the (B) pre-SBRT NLR <2.4 cohort and (C) the pre-SBRT NLR ≥2.4 cohort using the dNLR cut-off of 1.3.
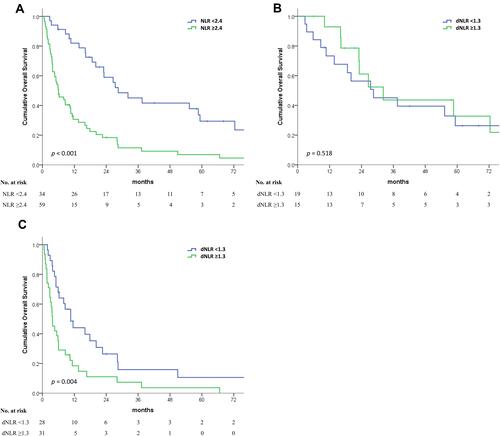
Figure 2 Box–whisker plot of peri-SBRT NLR changes in patients categorized according to (A) CTP class and (B) development of liver toxicity. Note only 90 patients were evaluable for liver toxicity. Extreme outliers and mild outliers were marked with an asterisk (*) and a circle (O) on the box–whisker plot, respectively.
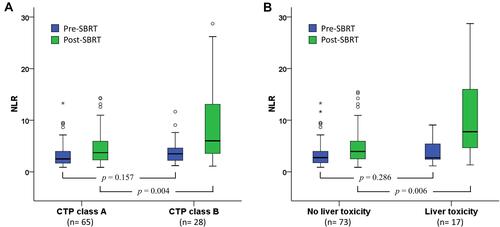
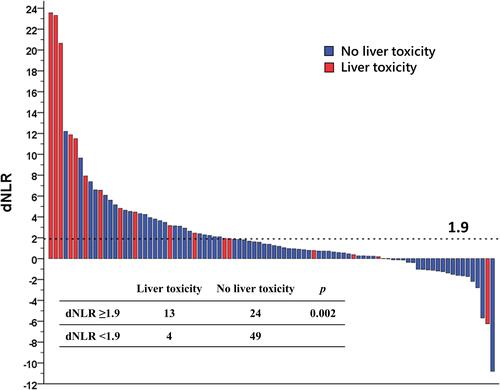
Figure 3 Waterfall plot of HCC patients ranked according to dNLR after SBRT. Patients with dNLR ≥1.9 were more likely to present with liver toxicity than those with dNLR <1.9.