Figures & data
Figure 1 Low expression of PTP4A3 is related to better patient survival. (A) The diagram illustrates the strategy for cisplatin- and doxorubicin-regulated candidates. (B and C) Kaplan–Meier survival curves of 2 groups of patients with hepatocellular carcinoma defined by different PTP4A3 expression levels established on the basis of Roessler liver microarray scores (n for each group=121, cutoff point=4.86 (the median), log-rank P<0.05). (D–F) The PTP4A3 level was highly correlated with higher alpha-fetoprotein (AFP) levels and predicted a high metastasis risk signature score and advanced pathological stage.
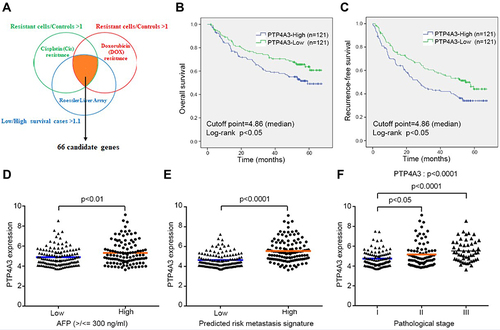
Table 1 Association of PTP4A3 Expression with Clinicopathologic Indicators of Hepatocellular Carcinoma
Table 2 Prognostic Significance of Clinicopathologic Indicators and PTP4A3 for Disease-Free Survival in the Clinical Cohort
Table 3 Prognostic Significance of Clinicopathologic Indicators and PTP4A3 for Overall Survival in the Clinical Cohort
Figure 2 The PTP4A3 expression level is associated with overall survival in hepatocellular carcinoma (HCC). (A and B) Kaplan–Meier survival curves of 2 groups of patients with HCC defined by different PTP4A3 expression cycles using qRT–PCR (n for each group=36, cutoff point=17.51 (39-ΔCt, the median), log-rank P<0.05). Patients with low expression of PTP4A3 have a better overall survival rate than those with high expression. (C) qRT–PCR was used to determine the PTP4A3 expression level, shown as the gene expression cycle (39-ΔCt), in HCC specimens. PTP4A3 expression is higher in patients with high alpha-fetoprotein (AFP) levels than in those with low AFP levels.
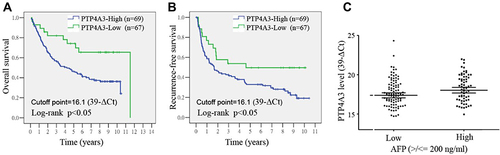
Figure 3 Examination of HCC cell viability after cisplatin or doxorubicin stimulation. The viability of HepG2 (A and E), Hep3B (B and F), Huh7 (C and G) and J7 (D and H) cells was determined after treatment with various concentrations of cisplatin (Cis, 0–10 μg/mL, A–D) or doxorubicin (Dox, 0–1 μg/mL, E-H) using the MTT assay. HCC cell viability decreased with cisplatin or doxorubicin treatment in a dose-dependent manner.
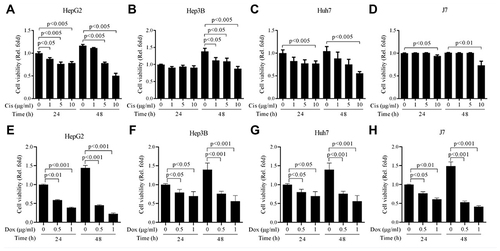
Figure 4 Assessment of PTP4A3 expression after cisplatin or doxorubicin stimulation. The PTP4A3 expression of HepG2 (A and E), Hep3B (B and F), Huh7 (C and G) and J7 (D and H) cells was determined after treatment with various doses of cisplatin (Cis, 0–10 μg/mL, A–D) or doxorubicin (Dox, 0–1 μg/mL, E-H) using Western blotting. The level of PTP4A3 expression in HCC cells was obviously decreased by cisplatin or doxorubicin.
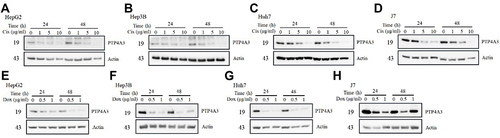
Figure 5 Assessment of the effect of PTP4A3 on cell viability. (A) The PTP4A3 basal level was determined by Western blotting. (B and C) PTP4A3 expression in J7 (B) and HepG2 (C) cells was silenced with PTP4A3 siRNA (KD1, KD2). The expression of PTP4A3 was obviously decreased after PTP4A3 siRNA transfection (KD1, KD2) compared with the vector control (VC) transfection. Cell viability was analyzed after PTP4A3 silencing using the MTT assay, and PTP4A3 slightly decreased cell viability in both J7 and HepG2 cells (B and C). (D and E) Cell viability was examined after PTP4A3 silencing with cisplatin (Cis) or doxorubicin (Dox) stimulation using the MTT assay, and PTP4A3 silencing further decreased the viability of J7 (D) and HepG2 (E) cells treated with cisplatin and/or doxorubicin.
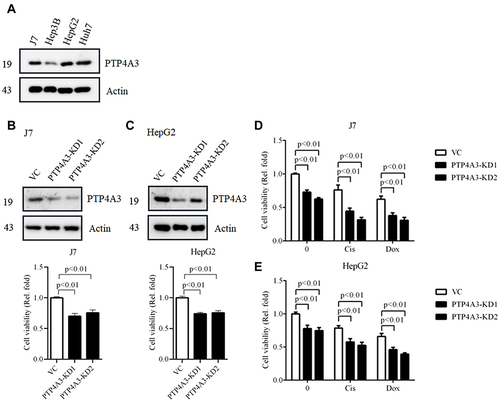
Figure 6 Assessment of the expression of PTP4A3-related molecules after cisplatin or doxorubicin stimulation. The levels of phospho (p)-STAT3, STAT3, p-JAK2, JAK2 and STAT5 in HepG2 (A and C) and Huh7 (B and D) cells were determined with various doses of cisplatin (Cis, 0–10 μg/mL, (A and B) or doxorubicin (Dox, 0–1 μg/mL, (C and D) using Western blotting. The levels of p-STAT3, STAT3, p-JAK2, JAK2 and STAT5 were obviously decreased with cisplatin or doxorubicin treatment.
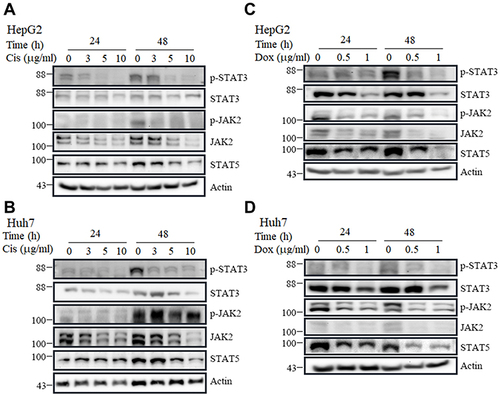
Figure 7 Assessment of IL-6/IL6R expression in clinical HCC specimens. (A–C) The levels of IL-6 were determined after cisplatin (A) or doxorubicin (B) treatment or PTP4A3 silencing (PTP4A3 knockdown (KD), (C) in J7 cells using ELISA. (D) The levels of STAT3, JAK2, IL-6 receptor (R) were determined with PTTP4A3 silencing (PTP4A3 KD) compared with vector control (CTL) by Western blotting. (E and F) Kaplan–Meier survival analysis of the overall and recurrence-free survival of HCC patients sorted into two groups based on PTP4A3 expression level (established on the basis of Roessler liver microarray scores) (n for each group=121, cutoff point=7.60 (median), log-rank P<0.05). (G) IL-6R expression was higher in patients with a high predicted risk metastasis signature score.
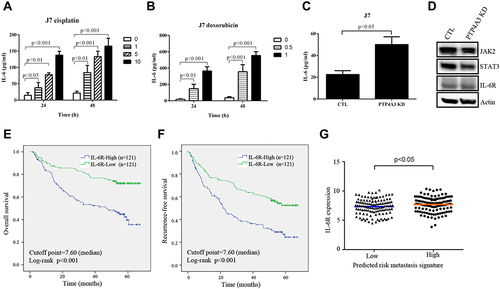
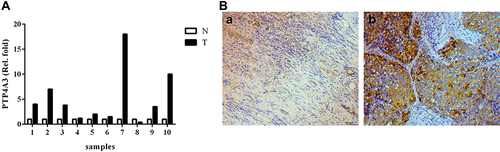
Figure 8 Assessment of PTP4A3 expression in clinical HCC specimens. (A) The levels of PTP4A3 in liver tissues of doxorubicin-treated patients were determined using qRT‒PCR. PTP4A3 expression was almost higher in tumor tissues (T) than in normal control tissues (N). (B) PTP4A3 expression was also higher in tumor tissues (B, b) of HCC patients than in normal control tissues (B, a) by immunohistochemistry.