
Figures & data
Figure 1 Flowchart demonstrating recruitment pathway for the population.
Abbreviations: cHCC‐CCA, combined hepatocellular‐ cholangiocarcinoma; HCC, hepatocellular carcinoma; CT, computed tomography; MRI, magnetic resonance imaging.
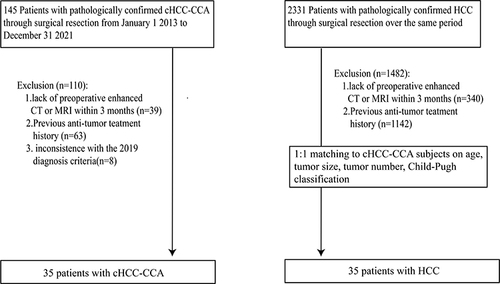
Table 1 Comparison of Clinico-Pathological Features Between cHCC-CCA and HCC
Figure 2 Example of a patient with tumor cells arranged by macrotrabecular or macrotrabecular-massive appearance (cHCC-CLC-Intermediate cells subtype). (A–D). contrast‐ enhanced CT images. (E–H and J). Hematein and Eosin staining. (F and H). macrotrabecular-massive permutation (![]()
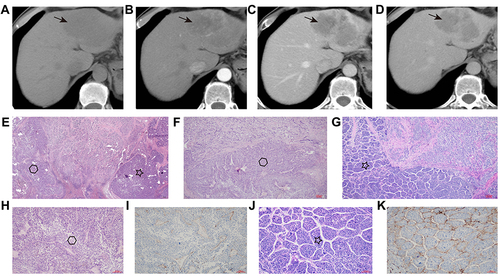
Table 2 The Results of Imaging Characteristics with Enhanced CT or MRI Between cHCC-CCA and HCC
Table 3 Univariate and Multivariate Regression Analysis of cHCC-CCA Patients
Table 4 Diagnostic Performance for cHCC‐ CCA