Figures & data
Table 1 BLAST of EDB-FN Amino Acid Sequence Showing 100% Homology Between Human and Woodchuck
Figure 1 TCGA data showing higher EDB-FN expression in HCC compared with that in the liver (A), and the inverse correlation of EDB-FN expression in HCC with patient survival (B).
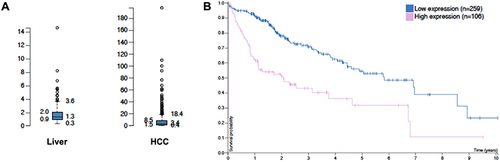
Figure 2 Validation results indicating highly expressed EDB-FN in the woodchuck HCC. (A) Higher EDB-FN expression in the woodchuck HCC compared to the surrounding hepatic tissues analyzed from the customized microarray data; Higher EDB-FN expression in HCC compared to the surrounding liver determined in harvested tissue samples from the woodchucks carrying HCC with RT-PCR (B) and Western blotting (C).
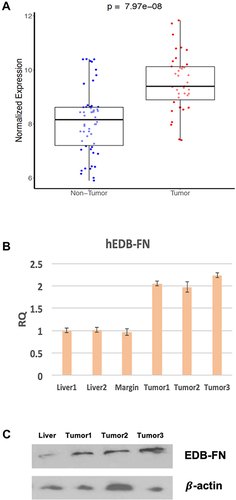
Figure 3 PET imaging of ZD2-[68Ga-NOTA] with woodchuck (#1701). (A) PET/CT overlays of coronal (left) and axial (right) cuts showing uptake in one HCC (T1 for tumor 1) with L for liver, S for stomach, and H for heart; (B) region-based uptake (in SUVs) as time activity curves for these organs.
![Figure 3 PET imaging of ZD2-[68Ga-NOTA] with woodchuck (#1701). (A) PET/CT overlays of coronal (left) and axial (right) cuts showing uptake in one HCC (T1 for tumor 1) with L for liver, S for stomach, and H for heart; (B) region-based uptake (in SUVs) as time activity curves for these organs.](/cms/asset/24527165-4f7d-410b-8dce-048131b73e38/djhc_a_12155680_f0003_c.jpg)
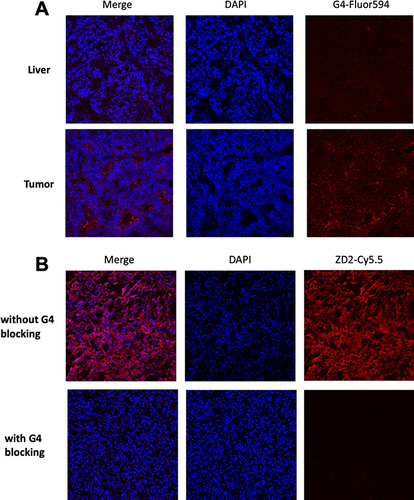
Figure 4 Histology analysis. (A) Immunofluorescence staining of woodchuck frozen sections (upper: liver, lower: tumor) with G4 anti-EDB-FN monoclonal antibody (red). While substantial EDB-FN was stained in the extracellular matrix of the HCC, normal liver was not stained; (B) Specific binding of ZD2 peptide to EDB-FN in woodchuck HCC was observed for strong binding of ZD2-Cy5.5 (red) in tumor tissues while little fluorescence staining was observed for the adjacent woodchuck HCC sections pre-incubated with G4 antibody and followed by ZD2-Cy5.5, indicating blockage of ZD2-Cy5.5 binding by G4 antibody (blocking).