Figures & data
Figure 1 Contrast-enhanced axial CT images of the liver in (A–C) display arterial and venous sequences of patients with different growth patterns and imaging biomarkers of hepatocellular carcinoma (HCC): non-rim arterial phase enhancement (arrow), washout with tumor-liver difference (dotted arrow), internal tumor arteries (arrowheads), tumor capsule (*), hypodense halo (†), peri-tumoral enhancement (‡), and index tumor (dotted circle).
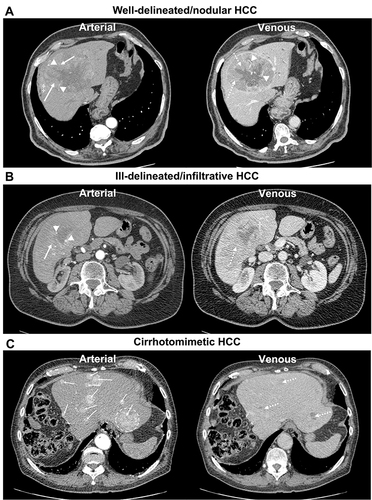
Figure 2 Overview of the segmentation process in a 79-year-old patient with multiple cirrhotomimetic hepatocellular carcinoma liver lesions (>30 in total). The five largest lesions in diameter (#; index lesion marked as #1) were segmented to analyze the volume. (A–C) display axial arterial, portal venous, and venous CE-CT sequences without tumor masks, while (D–F) include the generated tumor segmentations (green masks). Finally, (G) shows the coronal view of the liver with tumor masks of three of the largest HCC lesions, while (H) shows the 3D tumor masks of the five largest HCC lesions (abbreviations in (H): R = right, L = left, S = superior, I = inferior).
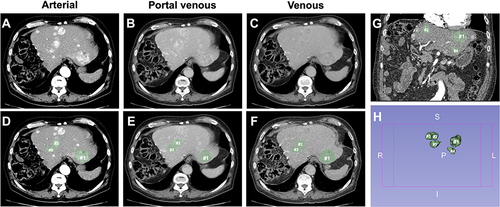
Table 1 Patient and Disease-Specific Characteristics and Treatment Data
Table 2 Imaging Biomarkers and Tumor Characteristics on Tri-Phasic Contrast-Enhanced CT within six Weeks Before Hepatopulmonary Shunt Evaluation Study
Table 3 Summary of Regression Models to Predict the Hepatopulmonary Shunt Fraction Including Constants, Significant Variables, Non-Standardized Coefficients, Standardized Coefficients, Standard Error, R2, Adjusted R2, and F-Statistics
Figure 3 Risk scores illustrating the predicted hepatopulmonary shunt fraction using non-invasive biomarkers on contrast-enhanced CT. Models included diameter of index tumor (A) or volume of index tumor (B), index tumor non-rim arterial phase enhancement (APHE), and washout. Recommendations regarding dose reduction and contraindications for the administration of yttrium-90 microspheres are based on the recommendations of the manufacturer Sirtex Medical Limited/S1-Guideline selective intra-arterial radiotherapy (SIRT) of malignant liver tumors of the German Society for Nuclear Medicine.Citation15
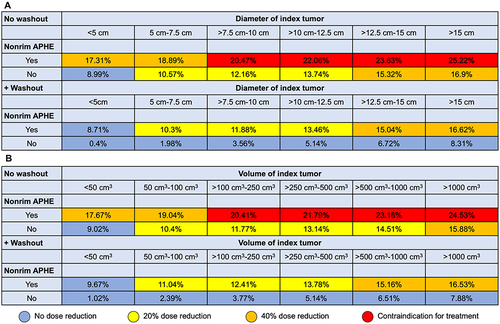
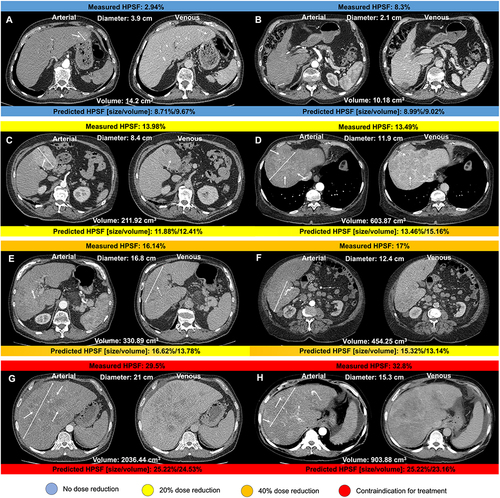
Figure 4 Arterial and venous axial contrast-enhanced CT images displaying hepatocellular carcinoma lesions (two-sided arrows indicate the maximum diameter of the index lesion) of patients recommended for transarterial radioembolization. Hepatopulmonary shunt fraction (HPSF) measured following angiography is shown above each image. Predicted HPSF using the predictive model based on imaging and clinical disease-specific parameters are shown below each image. Examples of non-rim arterial phase enhancement and washout are indicated by solid and dotted arrows, respectively. Recommendations for dose reduction and contraindications for yttrium-90 microspheres administration are color-coded. HPSF displayed in (A and B) resulted in no dose reduction; HPSF displayed in (C and D) resulted in 20% dose reduction; HPSF displayed in (E and F) resulted in 40% dose reduction; HPSF displayed in (G and H) were interpreted as a contraindication for treatment.Citation15