Figures & data
Table 1 Baseline Characteristics of Patients
Figure 1 Determination of the optimal cut-off value of GLR by X-tile analysis. (A) X-tile plot generated by GLR and survival data of the patients. The black point on the horizontal bar highlighted the optimal outcome-based cut-off value. (B) The histogram of the cohort. The cohort was divided into two groups based on the GLR cut-off value. (C) Kaplan–Meier curve displayed the difference of survival between high GLR and low GLR groups.
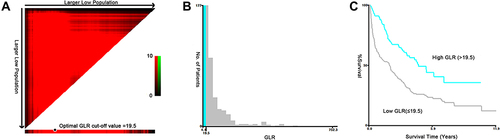
Table 2 Univariate and Multivariate Cox Proportional Hazard Regression Analyses of DFS
Table 3 Univariate and Multivariate Cox Proportional Hazard Regression Analyses of OS
Figure 2 Nomograms for the prediction of 1-, 3- and 5-year DFS and OS. Each independent prognostic factor identified in the Cox regression was assigned a point. The total points could be obtained by calculating the sum of all factors. With the total points, the probabilities of 1-, 3- and 5-year DFS (A) and OS (B) could be predicted.
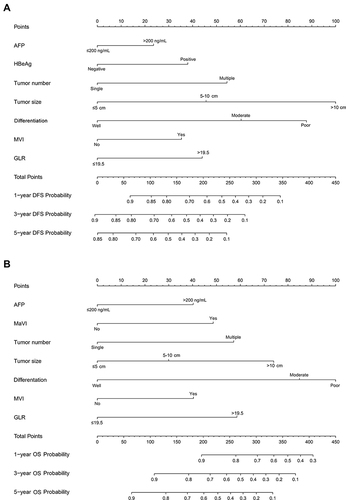
Figure 3 Evaluation of the performance of the nomograms in the training cohort. (A) ROC curves of the nomogram predicting 1-, 3- and 5-year DFS in the training cohort. (B) ROC curves of the nomogram predicting 1-, 3- and 5-year OS in the training cohort. (C) Calibration curves of the nomogram predicting 1-, 3- and 5-year DFS in the training cohort. (D) Calibration curves of the nomogram predicting 1-, 3- and 5-year OS in the training cohort.
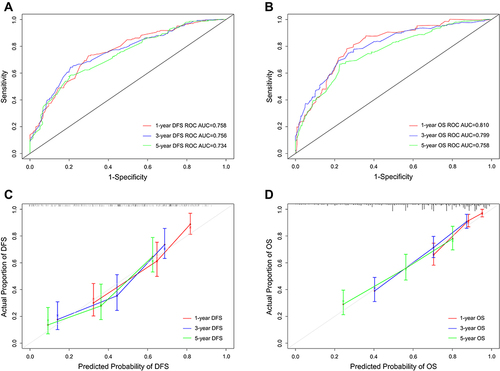
Figure 4 Performance of the nomograms in the validation cohort. (A) ROC curves of the nomogram predicting 1-, 3- and 5-year DFS in the validation cohort. (B) ROC curves of the nomogram predicting 1-, 3- and 5-year OS in the validation cohort. (C) Calibration curves of the nomogram predicting 1-, 3- and 5-year DFS in the validation cohort. (D) Calibration curves of the nomogram predicting 1-, 3- and 5-year OS in the validation cohort.
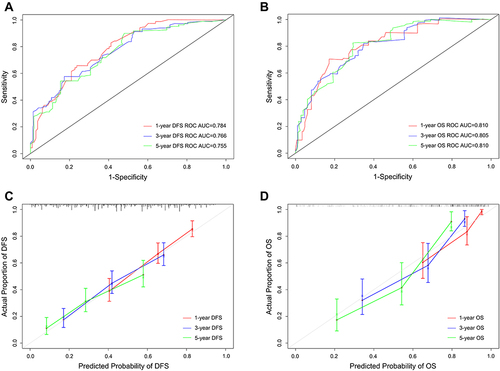
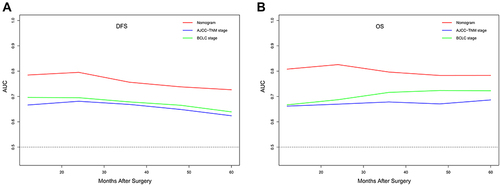
Figure 5 Time-dependent ROC curves of the nomograms, the TNM and the BCLC staging systems. (A) Time-dependent ROC curves of DFS predicting. (B) Time-dependent ROC curves of OS predicting.