Figures & data
Figure 1 Patient selection flowchart.
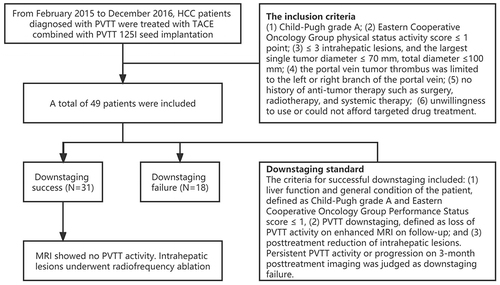
Table 1 Comparison of Baseline Characteristics Between the Success and Failed Downstaging Groups
Table 2 Treatment of RFA Within 6 Months in Patients in the Successful Downstaging Group
Table 3 Baseline Information on Different Ablation Outcomes in Patients with the Successful Downstaging Group
Figure 2 Images representing case patients.
Notes: A and B: Liver S7 showed a mass of approximately 44×78 mm in size, fifilling the defect with mild enhancement in the right portal vein, and the diagnosis was consistent with HCC with tumor thrombus formation in the right portal vein. C: The patient was placed in the prone position, and 125I seeds were implanted in the right portal vein tumor thrombus under CT guidance. : MRI at 3 months after two TACE treatments showed that the portal vein tumor thrombus was signifificantly reduced without enhancement, indicating that the tumor thrombus had no activity. E: Liver S7 showed local enhancement at the edge of the lesion, and it was considered that there was activity. F: The patient was placed in the prone position, and the active part of the tumor was treated with CT-guided radiofrequency ablation. G and H: At 3 months postoperatively, MR examination showed inactive portal vein tumor thrombus activity, also no enhancement of liver S7 mass. No activity was considered. Overall evaluation was complete response (modified Response Evaluation Criteria In Solid Tumors), and the patient was successfully downstaged.
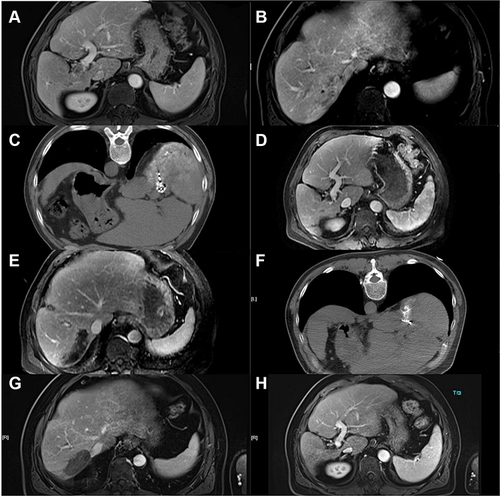
Table 4 Treatment Complications
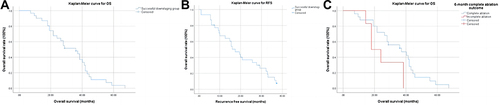
Figure 3 Kaplan-Meier curves for OS (A) and RFS (B) in patients with successful downstaging. Kaplan-Meier curves for OS (C) in patients with complete ablation and incomplete ablation.