Figures & data
Table 1 The Definition and Cut-off Value of Inflammation-Related Marker
Figure 1 The flow chart in the study.
Abbreviations: HCC, hepatocellular carcinoma; AFP, alpha-fetoprotein.
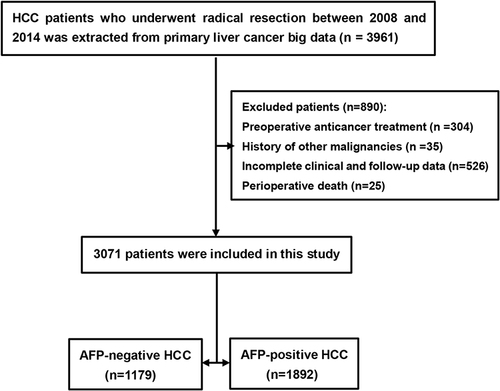
Table 2 Univariate Cox Regression Analysis of Factors Associated with OS and RFS in AFP-Negative HCC Patients
Table 3 Multivariable Cox Regression Analysis of Factors Associated with OS and RFS in AFP-Negative HCC Patients
Table 4 Baseline Characteristics of Patients
Figure 2 Comparison of prognosis between Low NrLR and High NrLR Groups. (A) OS before PSM; (B) RFS before PSM; (C) OS after PSM; (D) RFS after PSM.
Abbreviations: OS, overall survival; RFS, recurrence-free survival; NrLR, neutrophil times γ-glutamyl transpeptidase to lymphocyte ratio; PSM, propensity score matching.
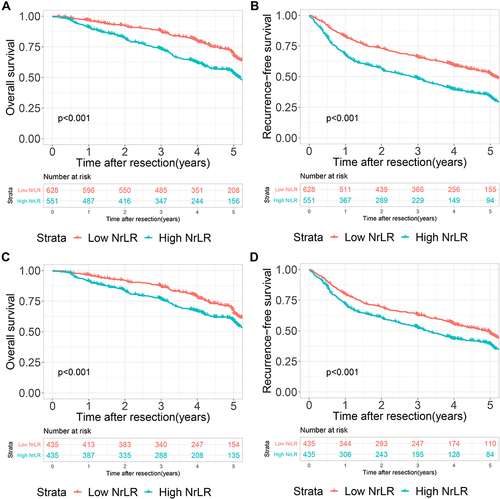
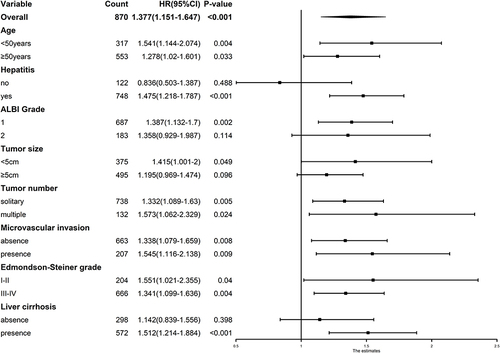
Figure 3 Comparison of overall survival between Low NrLR and High NrLR Groups in different subgroups.
Abbreviations: NrLR, neutrophil times γ-glutamyl transpeptidase to lymphocyte ratio; ALBI grade, albumin-bilirubin grade.
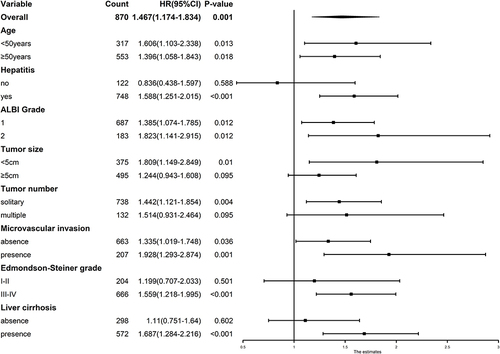
Figure 4 Comparison of recurrence-free survival between Low NrLR and High NrLR Groups in different subgroups.
Abbreviations: NrLR, neutrophil times γ-glutamyl transpeptidase to lymphocyte ratio; ALBI grade, albumin-bilirubin grade.