Figures & data
Table 1 Clinical Characteristics of Patients Receiving Lenvatinib Treatment for Advanced-Stage Hepatocellular Carcinoma
Table 2 Univariate and Multivariate Analyses of Prognostic Factor Affecting Progression-Free Survival of Patients with Hepatocellular Carcinoma Under Lenvatinib Treatment
Table 3 Univariate and Multivariate Analyses of Prognostic Factor Affecting Overall Survival of Patients with Hepatocellular Carcinoma Under Lenvatinib Treatment
Figure 1 Kaplan–Meier survival curves in patients with advanced hepatocellular carcinoma following lenvatinib treatment. (A) Progression-free survival curve, and the median time was 7.1 months. (B) Overall survival curve, and the median time was 17.7 months.
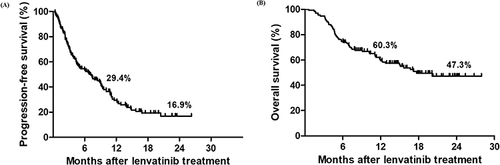
Figure 2 Comparison of cumulative survival curves according to AFP >10% reduction within the first 4 weeks of treatment for patients with baseline serum AFP ≥10 ng/mL (n = 97). (A) Progression-free survival curve. (B) Overall survival curve.
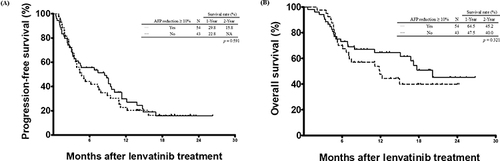
Figure 3 Comparison of cumulative survival curves according to AFP >10% reduction within the first 4 weeks of treatment for patients with baseline serum AFP >400 ng/mL (n = 46). (A) Progression-free survival curve. (B) Overall survival curve.
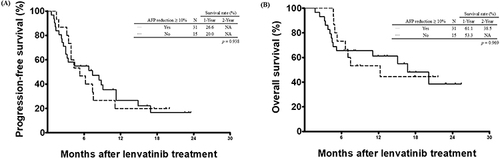
Figure 4 Comparison of cumulative survival curves according to neutrophil-lymphocyte ratio (NLR). Patients with pre-treatment NLR > 4.07 (n = 55) showed a significant worse outcome than those patients with NLR ≤ 4.07 (n = 88). (A) Progression-free survival curve. (p = 0.014) (B) Overall survival curve. (p = 0.010).
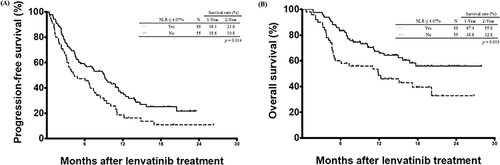
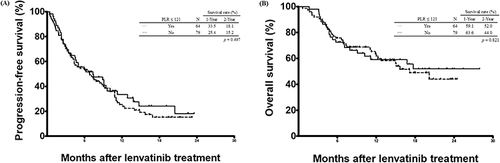
Figure 5 Comparison of cumulative survival curves according to platelet-lymphocyte ratio (PLR). No significant differences were observed for patients with lenvatinib treatment based on the PLR. (A) Progression-free survival curve. (p = 0.497) (B) Overall survival curve. (p = 0.821).