Figures & data
Table 1 Primers Used for Real-Time PCR
Figure 1 Ozonated water suppresses BELL7402 cell proliferation. (A) Liver cancer cell lines were treated with various concentrations of ozone (2.0,1.5,1.0 μg/mL) for 10 min, observe the morphology of cells. (B) Liver cancer cell lines were treated with various concentrations of ozone (2.2, 1.69, 1.51, or 1.09 μg/mL) for 10 min, 24h incubation Cell proliferation was assessed using a CCK-8 kit. *(C) Liver cancer cell lines were treated with 1.5μg/mL concentrations of ozone for 10 min, 24h, 36h, 48h incubation Cell proliferation was assessed using a CCK-8 kit. (D) Cell cycle detection by flow cytometry ****P<0.0001, n=3.
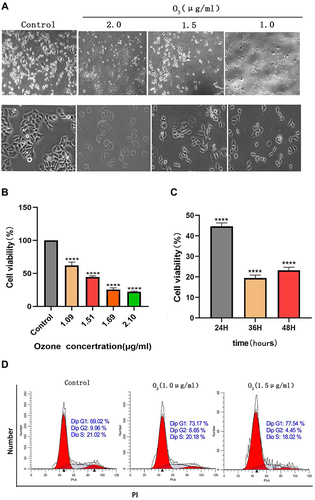
Figure 2 Ozonated water suppresses BELL7402 cell migration. Representative images and quantification of BELL7402 cells in wound healing assays, ×100 *P<0.05, **P<0.01, ***P<0.001, n=3.
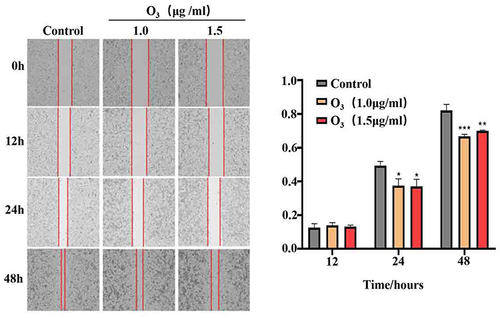
Figure 3 Ozonated water suppresses BELL7402 cells invasion. Representative images and quantification of BELL7402 cells in Transwell assay with matrigel, ×200;. *P<0.05, **P<0.01, n=3.
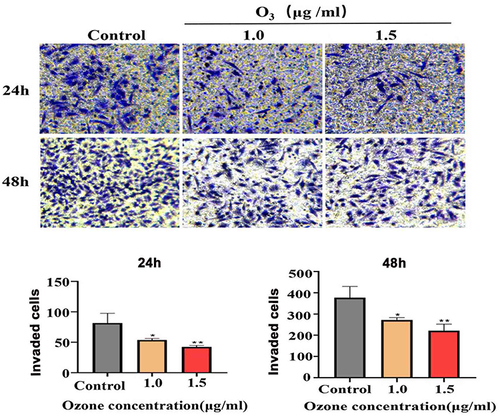
Figure 4 Expression of EMT and ECM degradation-related proteins detected using RT-qPCR and Western blotting analyses. *P<0.05, ***P<0.001, ****P<0.0001, n=3.
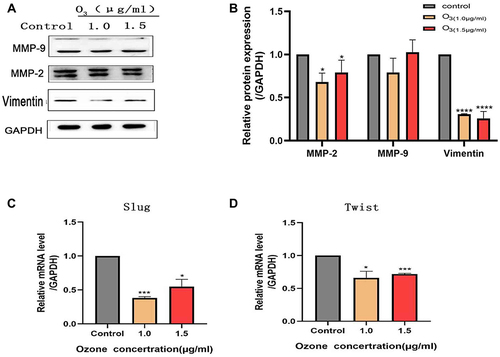
Figure 5 The expression of signaling moleculesHMGB1, p-NF-ΚB, NF-ΚB, and p-STAT3 was inhibited in BELL7402 cells after ozonated water treatment. (A) The expression of signaling moleculesHMGB1, p-NF-ΚB, NF-ΚB, and p-STAT3 proteins detected by Western Blot. (B) The expression of signaling moleculesHMGB1, p-NF-ΚB, NF-ΚB, and p-STAT3 proteins were assessed by one-way analysis of variance (ANOVA) with Dunnett’s test.**P<0.01, ***P<0.001, ****P<0.0001, n=3.
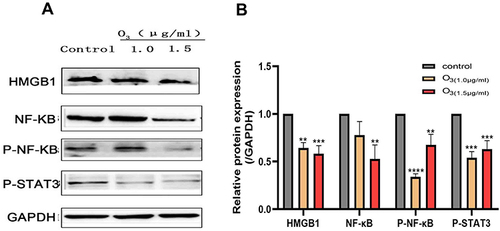
Figure 6 Cytokines HMGB1, IL-6, and TNF-α were detected using ELISA and their mRNA expression levels were detected using RT-qPCR. (A) The cytokine concentrations of HMGB1 and TNF-α were low in the group of cells treated with 1.0 and 1.5 μg/mL of ozonated water, and the concentration of IL-6 was low in the group of cells treated with 1.5μg/mL of ozonated water. (B) The mRNA expression of HMGB1 was low in the cells treated with 1.0 and 1.5 μg/mL of ozonated water, and the mRNA expression levels of IL-6 and TNF-α were low in the group of cells treated with 1.5 μg/mL *P<0.05, ** P<0.01, *** P<0.001**** P<0.0001, n=3.
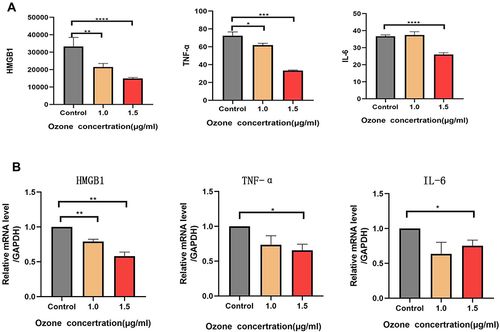
Figure 7 Effect of ozone on ROS levels in HCC cells. Intracellular ROS levels were determined by staining cells with DCFH-DA (10 μM) and assessed by flow cytometry. The charts display the relative fluorescent intensities of different cell populations. *P<0.05, **** P<0.0001, n=3.
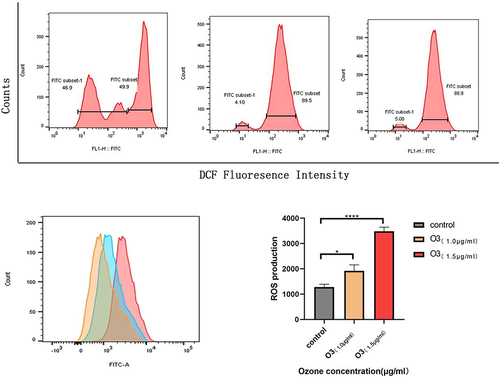
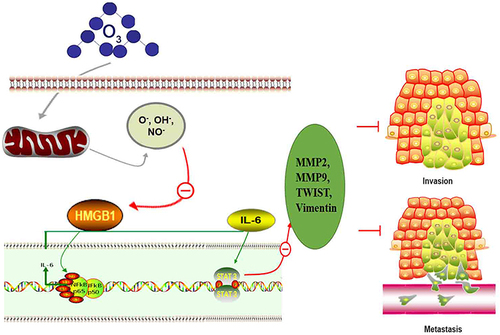
Figure 8 Schematic model of the mechanisms by which ozonated water inhibits HCC cell migration and invasion.