Figures & data
Table 1 Clinicopathological Characteristics According STEAP4 Expression in Hepatocellular Carcinoma immunohistochemical Cohort
Figure 1 The expression of STEAP4 in patients with hepatocellular carcinoma (HCC) in the TCGA database. (A) STEAP4 expression levels in different cancer and normal tissues were analyzed using the TIMER database (**p < 0.01, ***p < 0.001). (B and C) Plot chart showing the mRNA and protein expression levels of STEAP4 in HCC compared with normal control using the UALCAN database. (D) The Oncoprint of the STEAP4 gene alteration showing various genetic alterations with different colors in HCC samples using cBioPortal database. The bar diagram represents STEAP4 alteration frequencies according to HCC cohorts. (E) Box plot showing the relationship between STEAP genetic alteration and expression level. (F) Scatter plot showing the relation of STEAP4 expression with methylation level.
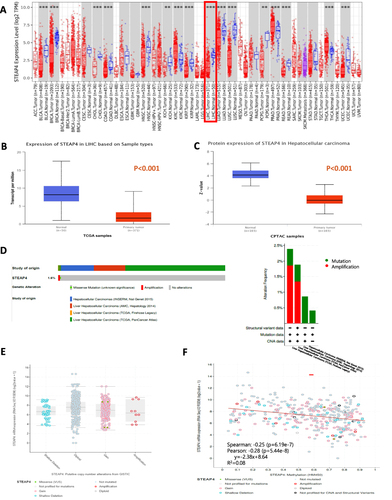
Figure 2 The correlation of STEAP4 mRNA expression with clinical characteristics and prognosis. The expression of STEAP4 in hepatocellular carcinoma was analyzed according to (A) Histological subtype, (B) Tumor grade, (C) Pathologic tumor stage, and (D) Clinical stage (*p < 0.05, **p < 0.01, ***p < 0.001). The effect of STEAP4 mRNA expression on (E) Recurrence-free survival and (F) Overall survival was analyzed using Kaplan–Meier plotter database.
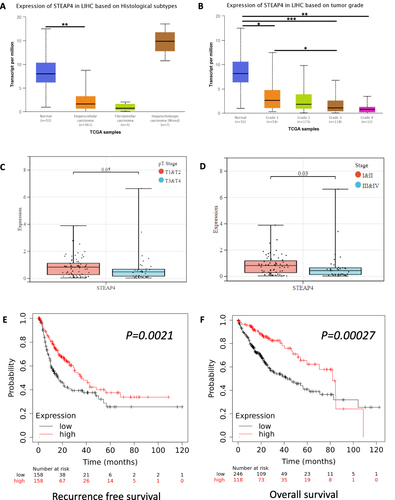
Figure 3 STEAP4 protein expression analysis of cases with hepatocellular carcinoma (HCC) in immunohistochemical analysis. (A) In the non-neoplastic tissue, STEAP4 expression showed a diffusely even pattern. (B and C) In the HCC sample, STEAP4 expression showed the clumping pattern in cytoplasm and membranous reaction; retained expression (B) and reduced expression (C) (x400). (D) A reduced expression of STEAP4 was significantly associated with shorter RFS (p = 0.034).
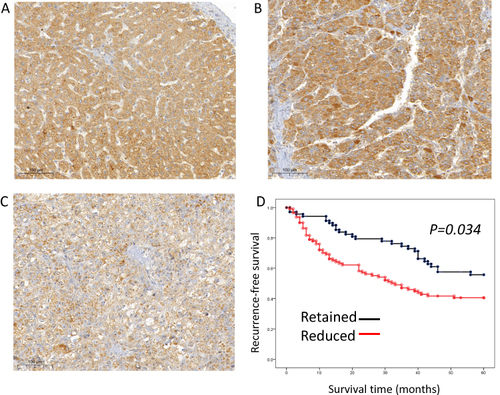
Table 2 Univariate and Multivariate Analyses of Recurrence-Free Survival in the Hepatocellular Carcinoma
Figure 4 Gene enrichment analysis of STEAP4 in hepatocellular carcinoma (HCC). (A) The volcano plots of DEGs represented the upregulated and downregulated genes in red and blue and Heatmap depicted the top 50 positively and negatively correlated genes of STEAP4 in HCC. (B) The results of Kyoto Encyclopedia of Genes and Genomes pathway analysis of upregulated genes enrichment. (C)The gene ontology of STEAP4 was analyzed according to biological functional enrichment. (D and E) The results of gene set enrichment analysis based on Kyoto Encyclopedia of Genes and Genomes databases..
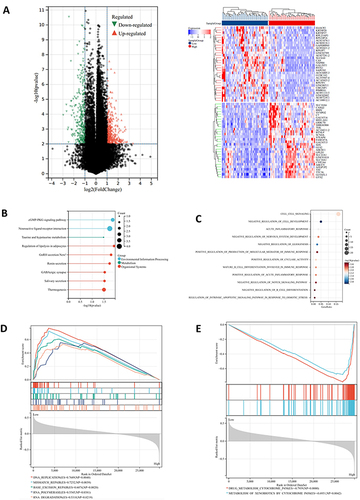
Figure 5 (A) The significantly somatic mutated genes in the STEAP4 low and high groups. (B) The relationship between STEAP4 expression and immune score, stromal score, and ESTIMATE score (C) Survival analysis of CD4, CD8, Treg, B cell, macrophage, and cancer-associated fibroblast. (D) Correlation between STEAP4 and 21 kinds of tumor microenvironment infiltrating immune cells analyzed using CIBERSORT.
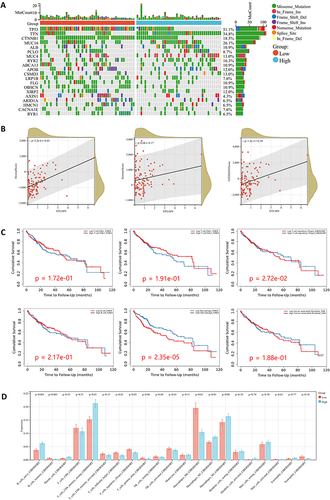
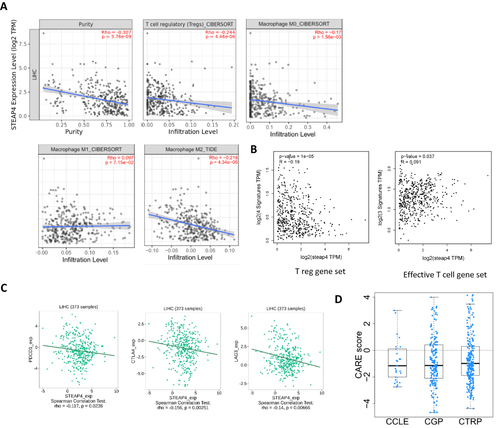
Figure 6 (A) Correlation between STEAP4 and immune cells such as T regs, M0, M1, and M2 macrophages (B) Correlation between STEAP4 expression and Treg gene set. (C) The relationship between STEAP4 and immune check points such as PDCD1, CTLA4, and LAG3. (D) The negative correlation between CARE scores and many compounds found in the Cancer Cell Line Encyclopedia (CCLE), Genomics of Drug Sensitivity in Cancer (GDSC), and Cancer Therapeutics Response Portal (CTRP) databases.