Figures & data
Figure 1 Construction of FRGs prognostic signature in TCGA training set. (A) The 82 overlapping genes analyzed by differentially expressed analysis and univariate Cox regression analysis are called OS-gene. (B–C) the least absolute shrinkage and selection operator (LASSO) regression were performed in OS training set with the penalty parameter estimated by 15-fold cross-validation. (D) Lollipop diagrams of LASSO coefficient for OS signature. (E) The KM survival curve for 12 FRGs in TCGA training set.
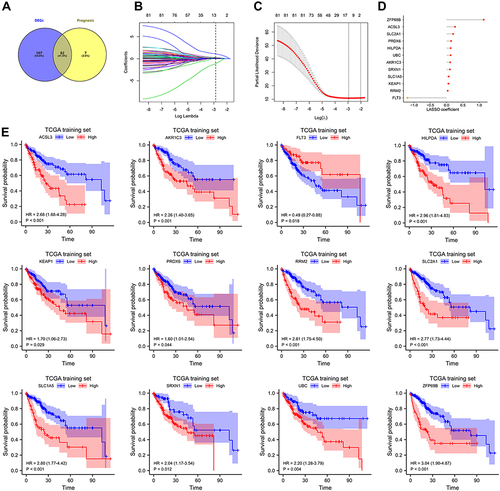
Figure 2 Internal and external validation of FRGs prognostic signature. Prognostic stratification analysis, Kaplan–Meier curve analysis and time-dependent ROC curve analysis of the 12 FRGs signature in TCGA training set (A–C), TCGA validation set (D–F), TCGA entire set (G–I) and ICGC cohort (J–L).
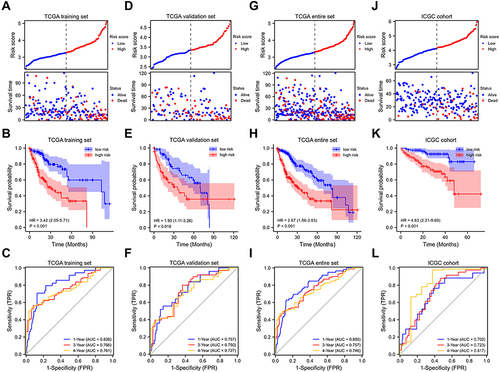
Figure 3 Association between risk score and clinicopathological characteristics. Correlation between risk score and TNM stage, histologic grade in in TCGA training set (A–D), TCGA validation set (E–H), TCGA entire set (I–L). Univariate and multivariate Cox regression analyses in different TCGA cohorts (M–O). *p < 0.05, **p < 0.01, ***p < 0.001.
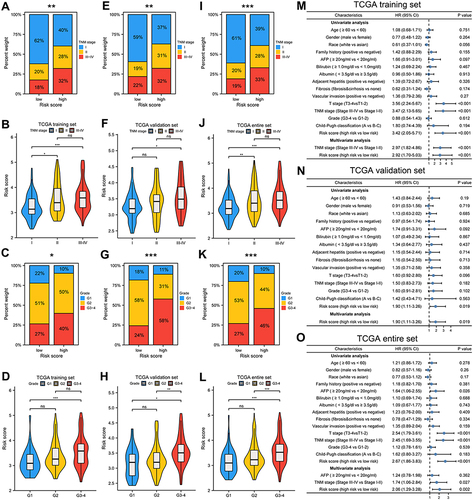
Figure 4 Mutation analysis and pathway enrichment in high and low risk group of TCGA cohort. (A and C) Mutation information of top 20 genes in low and high risk group of TCGA cohort. Different colors represented different types of mutations. (B) Differentially mutated genes in two groups for OS with fisher test. (D–G) TP53 mutation status was significantly correlated with risk score, whether with TP53 alterations or wild type TP53, patients in high-risk group had significantly poorer prognosis than patients in low-risk group. (H–I) GSEA enrichment analysis for different risk group in TCGA cohort. (J–K) The correlation between risk score and SOFs and transcriptional changes in SOFs in different subgroups. p-values were showed as follows: *p < 0.05, **p < 0.01, ***p < 0.001.
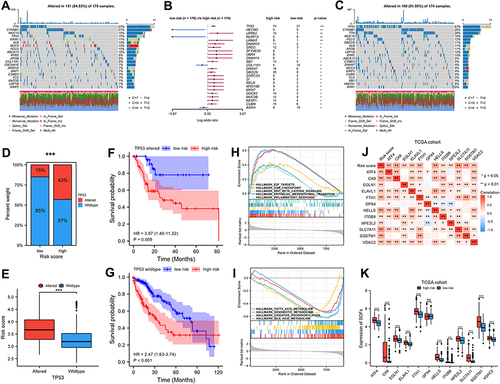
Figure 5 The difference of immune cell infiltration and ICIs related-genes in different risk groups. (A) The landscape of 18 immune cell infiltration proportions for TCGA cohort. (B) Correlation between immune cell infiltration level and risk score. (C) Risk score was significantly negatively correlated with activated CD8 T cell, cytolytic activity, and Th1 cell, and positively correlated with Th 2 cell. (D–F) High risk scores were positively correlated with high expression of PD1, CD80, CD47, HAVCR2, CTLA4, and B7-H3. p-values were showed as follows: *p < 0.05, **p < 0.01, ***p < 0.001.
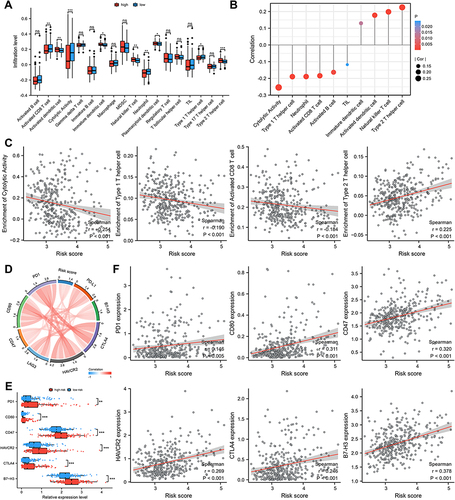
Figure 6 Signature predicts immunotherapy response. (A) Difference in IPS based on FRGs signature. Therapeutic response to ICB therapy from ImmuneCellAI (B and C) and TIDE score (D and E). (F–I) Risk scores were positively correlated with TIDE score, T cell exclusion and enrichment of MDSC but negatively correlated with T cell dysfunction. p-values were showed as follows: *p < 0.05, **p < 0.01, ***p < 0.001.
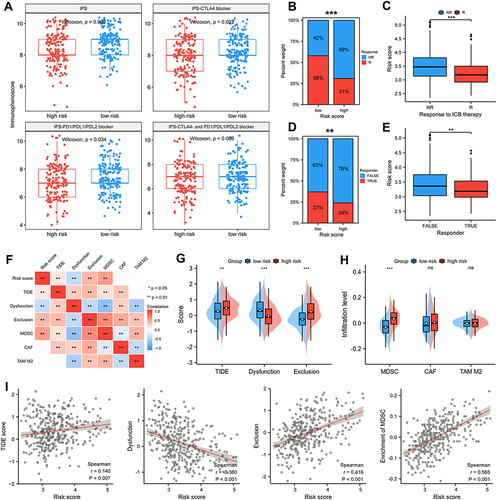
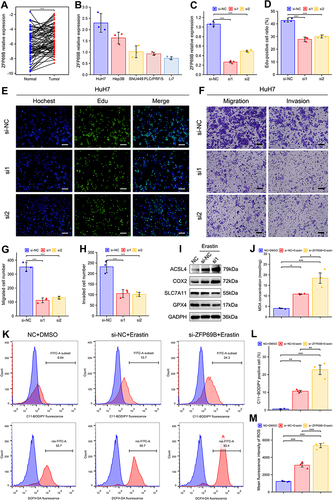
Figure 7 ZFP69B promotes HCC cellular proliferation, migration, invasion and erastin-induced ferroptosis. (A) ZFP69B mRNA levels were significantly high than their paired adjacent tissues. (B) Higher ZFP69B expression in Huh7 than other HCC cell lines. (C) The knockdown effect of ZFP69B in HuH7 cell. (D and E) EdU assays demonstrated that knockdown of ZFP69B significantly suppressed the cell proliferation rate in si-ZFP69B groups. Scale bar = 100 µm. (F–H) Transwell assays indicated that cellular migration and invasion abilities were significantly inhibited after ZFP69B knockdown. Scale bar = 100 µm. (I) Western blot assays were employed to measure the expression of ferroptosis-related proteins at protein levels in HuH7 cells. (J) MDA levels in the cell lysates of HuH7 cell were detected by MDA kits. (K–M) Lipid ROS and total ROS levels were analyzed by C11-BODIPY and DCFH-DA with flow cytometry. p-values were showed as follows: *p < 0.05, **p < 0.01, ***p < 0.001.