Figures & data
Figure 1 Esculetin’s effect on HUH7 and HCCLM3 cells. (A and B) Esculetin’s inhibition time (12, 24, 48 or 72h) and concentration (10–200 μΜ) on HUH7 and HCCLM3 cells was screened using the CCK8 assay. (C) Esculetin’s ability to suppress cells was displayed by crystal violet. (D and E) Using the wound healing assays and (F and G) the Transwell TM, the effects of esculetin on cells migration were examined. The results were displayed as mean ± SD. Compared with the Control group, *p<0.05, **p<0.01. Compared with the ESCL group, #p<0.05, ##p<0.01. Compared with the ESC-12h group, *p<0.05, **p<0.01 in A and B.
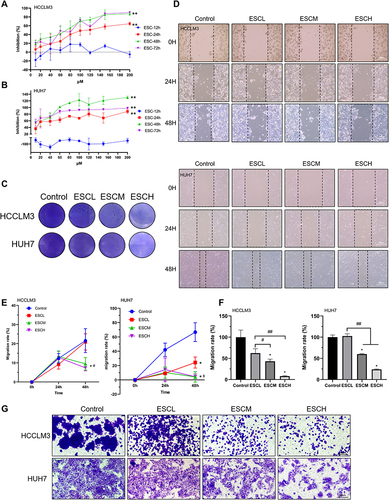
Figure 2 Esculetin induces apoptosis and ROS production in HUH7 and HCCLM3 cells. (A) Annexin V-FITC/PI in cells was detected by flow cytometry and the outcomes are represented by the (B) apoptosis rate and (C) necrosis rate. ROS in cells was observed using confocal microscopy (D and E) and flow cytometry (F). The results are displayed as mean ± SD. Compared with the Control group, *p<0.05, **p<0.01. Compared with the ESCL group, #p<0.05, ##p<0.01.
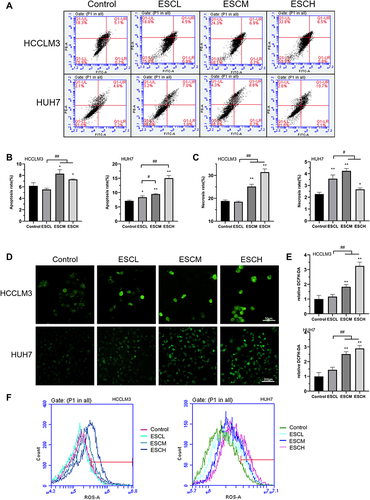
Figure 3 Esculetin’s effects on antioxidant levels in HUH7 and HCCLM3 cells. The ability of cells to produce antioxidants was evaluated using the (A) T-AOC assay and (B) DPPH free radical scavenging rate. (C and D) The proteins expressions of cells antioxidation were examined by Western blot. The results are displayed as mean ± SD. Compared with the Control group, *p<0.05, **p<0.01. Compared with the ESCL group, #p<0.05, ##p<0.01.
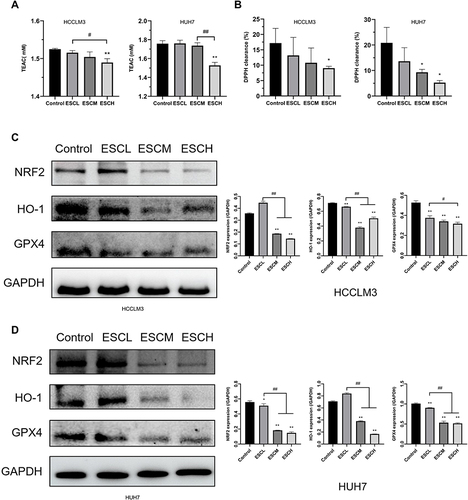
Figure 4 Esculetin’s effects on lysosomes, Fe2+ and ferroptosis in HUH7 and HCCLM3 cells. (A) The CCK8 assay was used to examine whether ferrostatin-1, bafilomycin and 3-MA could influence efficacy of esculetin on HUH7 and HCCLM3 cells. (B and D) Utilizing co-staining of MTG and LTR analyzed the autophagy-lysosome state in cells. (C and E) Utilizing JC-1 stain examined the state of the cells’ mitochondrial membrane potential. (F–H) Utilizing the FerroOrange probe, Fe2+ level in cells were measured. The results are displayed as mean ± SD. Compared with the Control group, *p<0.05, **p<0.01. Compared with the ESCL group, ##p<0.01. Compared with the ESC- 20μΜ in A, *p<0.05, **p<0.01.
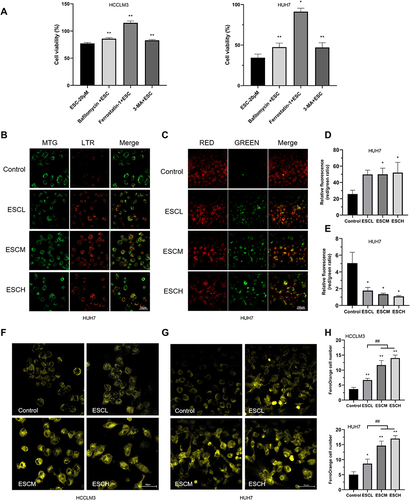
Figure 5 Esculetin’s effects on lipid peroxidation and ferritinophagy-proteins in HUH7 and HCCLM3 cells. (A) Using the Liperfluo probe and (B) flow cytometry, lipid peroxidation was measured in cells. (C and D) Ferritinophagy-related proteins were detected by Western blot. (E) The p62 and LC3-II expressions in cells after Baf and ESCM co-treatment were examined by Western blot. The results were displayed as mean ± SD. Compared with the Control group, *p<0.05, **p<0.01. Compared with the ESCL group, ##p<0.01. Compared with the bafilomycin +ESCM group in E, ##p<0.01.
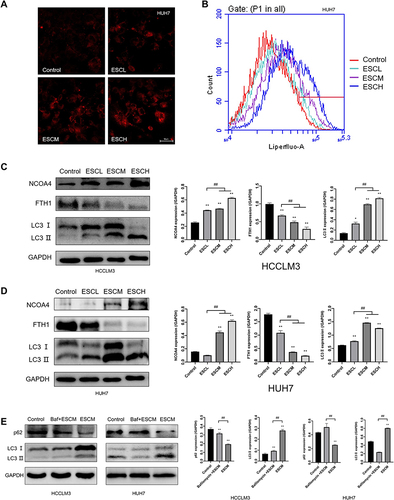
Figure 6 Esculetin’s effects on ferritinophagy colocalization following siNCOA4 silencing, OEFTH1 overexpression and siLC3II silencing in HUH7 and HCCLM3 cells. (A and B) The efficiencies of siNCOA4, siLC3II and OEFTH1 overexpression were detected using Western blot. (C and D) With immunofluorescence staining, the influences of Esculetin, siNCOA4, siLC3II and OEFTH1 on LC3II and NCOA4 co-localization expression were all analyzed. The results were displayed as mean ± SD. Compared with the siNC or OENC group, ** p<0.01.
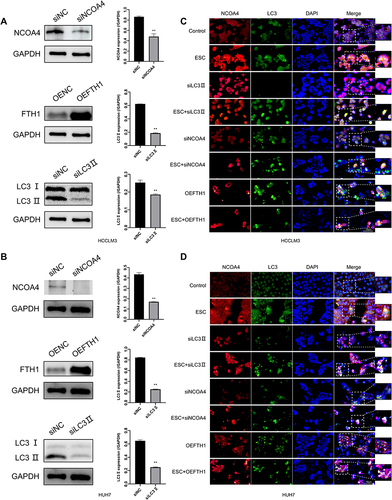
Figure 7 Esculetin’s effects on hepatocellular cancer in vivo. (A) Every three days, mice’s body weight was recorded. (B) The implanted tumor’s length and width were recorded 5 times and expressed as suppression rate. (C and D), (E and F) When the study ended, serum was analyzed for hydroxyl radical inhibition ability, GSH, Fe2+ and MDA. (G) The iron deposition of ferritinophagy-phenomenon in tumour tissues was confirmed using Prussian blue staining. (H) The esculetin-induced pathological changes in the lung, heart, liver, spleen and kidneys of nude mice were observed by H&E staining. The scale bar represents 50 μm (n=3). The results were displayed as mean ± SD. Compared with the Control group, *p<0.05, **p<0.01. Compared with the 10mg/kg group, #p<0.05, ##p<0.01.
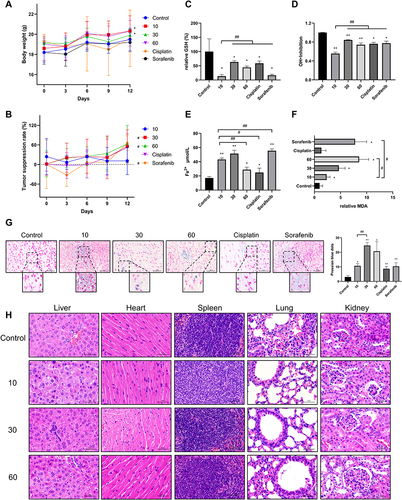
Figure 8 Esculetin’s effects on hepatocellular cancer proteins expression in vivo. Using immunohistochemistry, (A and B) KI67 expression, (C and D) antioxidant protein NFE2L2, GPX4 and HO-1 expression, (E and F) ferritinophagy-proteins NCOA4, FTH1 and LC3 expression were measured. The ruler measures 50μm. The results were displayed as mean ± SD (n=3). Compared with the Control group, *p<0.05, **p<0.01. Compared with the 10mg/kg group, #p<0.05, ##p<0.01.
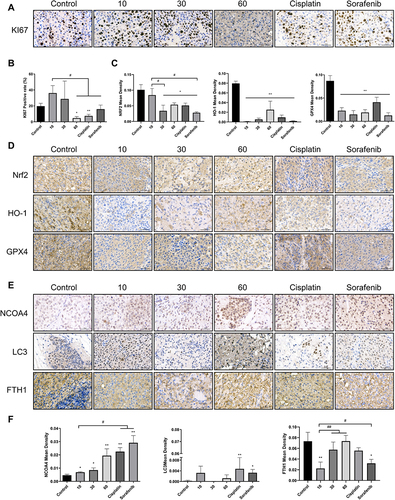
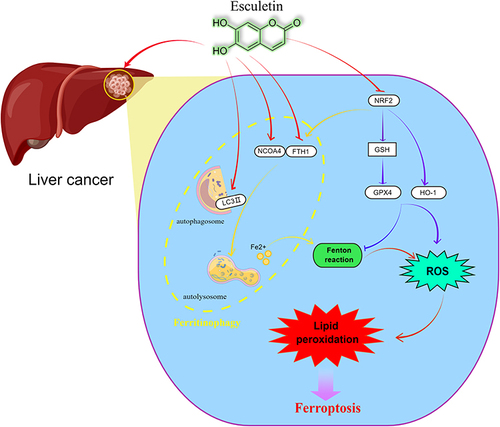
Figure 9 Esculetin can control NCOA4 and FTH1 expressions, regulate lysosomes and LC3-II activities to increase the level of autophagy and induce ferritinophagy to modify ferritin to produce Fe2+. The Fenton reaction leads to the production of the hydroxyl radical, as a consequence of the cell iron accumulating, resulting in oxidative stress and increasing in ROS production. A high production of cell ROS can lead to lipid peroxidation and ferritinophagy. Meanwhile, esculetin can decrease GSH expression by suppressing NFE2L2 and its target protein GPX4 expression, which is the main ferroptosis regulator. Esculetin can also suppress the expressions of the GPX4 target proteins, FTH1 and HO-1, promote ROS buildup and finally activate ferroptosis that is caused by ferritinophagy. By figdraw (www.figdraw.com).