Figures & data
Figure 1 Patient selection.
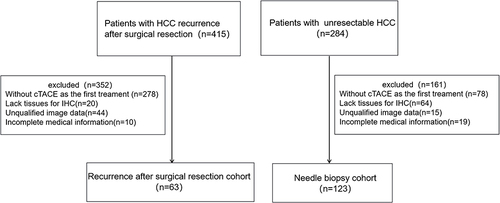
Table 1 Clinical and Pathological Features of the Patients According to MTM, VETC, CK19-Positive Type in Recurrence after Surgical Resection Cohort
Table 2 Clinical and Pathological Features of the Patients According to MTM, VETC, CK19-Positive Type in Liver Biopsy Cohort
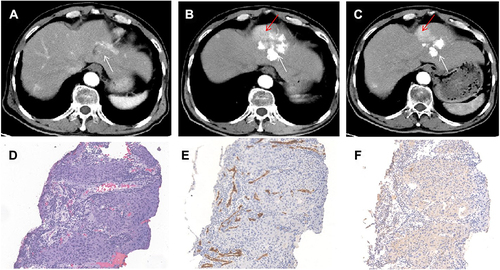
Figure 2 Images in a 34-year-old female (case 50) with non-VETC, non-MTT, CK19-positive HCC (lesion 1, S2 segment), VETC HCC, non-MTT, CK19-positive HCC (lesion 2, S6 segment) and baseline serum AFP level of 273 ng/mL. (A), lesion 1, 2.4 cm and (D), lesion 2, 4.5cm baseline HAP images (white arrow); (B and E): plain CT after the first session of cTACE, sparse and <50% (lesion 1), defect and >50% (lesion 2) lipiodol deposition (white arrow); (C and F): HAP Gd-EOB-DTPA MRI after the first session of cTACE: SD (lesion 1), PR (lesion 2) (alive lesion: red arrow); (G and M) HE of lesion 1 and 2, tumor cells were nest like and invasively grew; (H and N): non-VETC (lesion 1) and VETC (lesion 2) according to CD34 IHC; (I and O): lesion 1 and lesion 2 were both CK-19 strong positiveness; (J and P): lesions 1 and 2 were Glypican-3 positive; (K and Q): lesions 1 and 2 were Ki67 80% and 70% positiveness; (L and R): AFP negative (lesion 1) and positive (lesion 2) (×40 magnification).
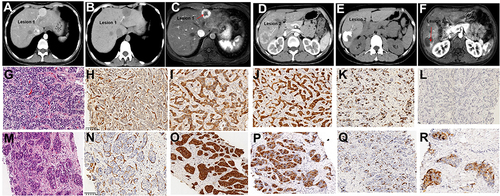
Figure 3 The correlation among different pathological types and tumor response in the whole cohort. (A), VETC and MTT types were significantly associated with each other (P=0.001); (B and C), VETC, not MTM, was negatively associated with CK19 expression of tumor cells (P=0.036, P=0.212,); (D), tumor response after the first cTACE according to mRECIST among different pathological HCC types. In 32 CR cases, 20 were VETC type, and 31 were CK19-negative type.
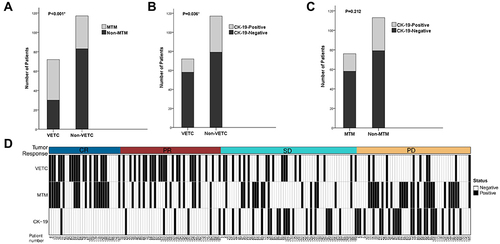
Figure 4 Images in a 49-year-old man (case 100) with S5 VETC, MTT, and CK19-negative HCC, BCLC A stage and baseline serum AFP level of 1671 ng/mL. (A), baseline HAP image (5.2cm, white arrow); (B), HAP CT, and (C), HAP Gd-EOB-DTPA MRI after the first session of cTACE: compact and >50% lipiodol deposition without alive lesion (white arrow), tumor response is CR according to mRECIST; (D), HAP CT, and (E), HAP Gd-EOB-DTPA MRI: lipiodol deposition was stable and remained CR after 15 months (white arrow); (F), macrotrabecular growth pattern was seen; (G), HCC was VETC according to CD34 IHC; H CK19 was negative (×40 magnification). HAP: hepatic artery phase.
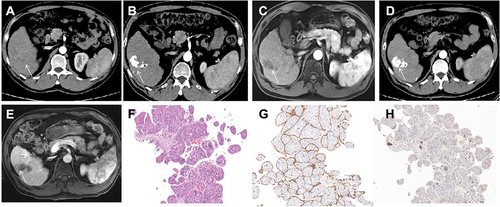
Figure 5 Lipiodol deposition rate and ORR after the first cTACE in the whole cohort (189 cases). (A–C), VETC, MTT and CK19-negative HCCs were significantly associated with more than 50% lipiodol deposition (P<0.001, P=0.017, P=0.002, respectively); (D–F): VETC and CK19-negative, but not MTM HCCs, were significantly associated with better ORR (P<0.001).
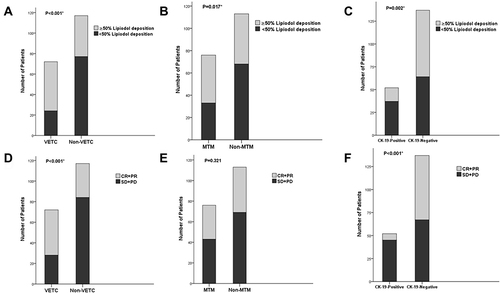
Figure 6 PFS and OS among different pathological types in the whole cohort. (A and B), cTACE therapy prolongs PFS of VETC not MTM HCCs (P=0.001, P=0.618, respectively); (C), CK19-positive HCCs resistant to cTACE therapy (P<0.001); (D–F), OS of VETC and non-VETC, MTM and non-MTM, CK19-positive and CK19-negative HCCs were not significantly different (P=0.636, P=0.300, P=0.151, respectively).
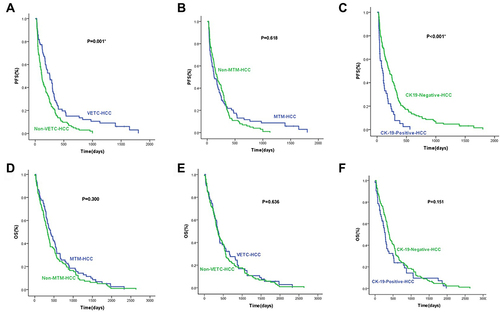
Table 3 Univariate and Multivariate Analyses of Clinical, Biological, and Pathological Types for ORR of the First cTACE Treatment by Logistic Regression Analysis in the Whole Cohort
Figure 7 Lipiodol deposition rate and ORR to the second cTACE session in the whole cohort (84 cases). (A–C), VETC, MTM and CK19-negative HCCs were significantly associated with more than 50% lipiodol deposition (P<0.001, P=0.027, P=0.04, respectively); (D–F): VETC, not MTM and CK19-positive HCCs were significantly associated with better ORR to the second cTACE (P=0.01, P=0.11, P=0.129, respectively).
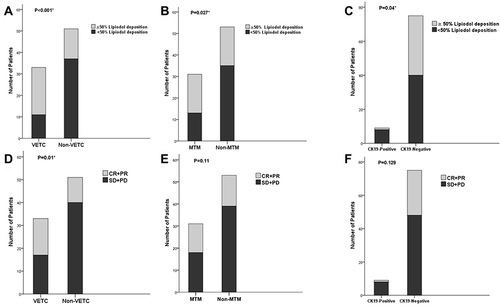
Figure 8 Images in a 51-year-old man (case 91) with S8 VETC, MTM-HCC, BCLC C stage and baseline serum AFP level of 450.7 ng/mL. (A) baseline HAP CT image (8.9cm, white arrow); (B), HAP CT after the first session of cTACE: defect and about 50% lipiodol deposition (white arrow), tumor response is PR according to mRECIST (alive lesion: red arrow); (C), HAP after the second session of cTACE: lipiodol further deposed in alive lesion and original deposition remained unchanged and partial necrosis (✳); (D), HE of HCC showed tumor cell was MTM; (E), HCC was VETC according to CD34 IHC; (F), CK19 IHC was negative (×40 magnification).
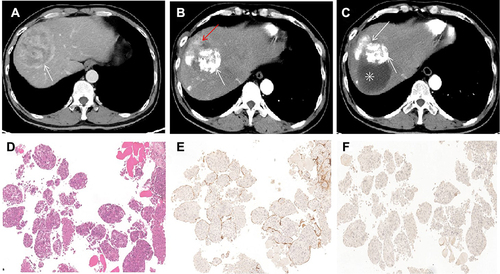
Figure 9 Images in a 66-year-old man (case 146) with S2 non-VETC, non-MTM, CK19-negative HCC, BCLC B stage and baseline serum AFP level of 24 ng/mL. (A), baseline HAP CT image showed a hyperenhanced HCC in the S2 liver lobe; (B), HAP CT after the first session of cTACE: defect and about 50% lipiodol deposition (white arrow), tumor response is PR according to mRECIST (alive lesion: red arrow); (C), HAP CT after the second session of cTACE: lipiodol deposition was not increased in alive lesion (red arrow); (D), HE of HCC showed tumor cells were distributed in flakes with a large number of lymphocytes infiltration; (E), HCC was non-VETC according to CD34 IHC; (F), CK19 was negative (×40 magnification).