Figures & data
Figure 1 Genomic analysis identified FAT1. (A) Flow chart of the protocol for genomic analysis of CTC and tissue DNA. (B) CTC and tissue genomic variants in patients with HCC. (C) Fluorescence images of captured CTCs. (D) The top five genes with the highest mutation frequency. (E) Combined analysis of CTC and tissue gene mutations. (F) Analysis of FAT1 protein levels in ten patients with HCC (n = 10, rank sum test, *P < 0.05). (G) Representative IHC staining for FAT1 from HCC tissues and adjacent non-tumor tissues. Upper row (I, from left to right): FAT1 expression was higher in tumor tissues than in adjacent non-tumor tissue; lower row (II, from left to right): FAT1 expression was lower in tumor tissues than in adjacent non-tumor tissues.
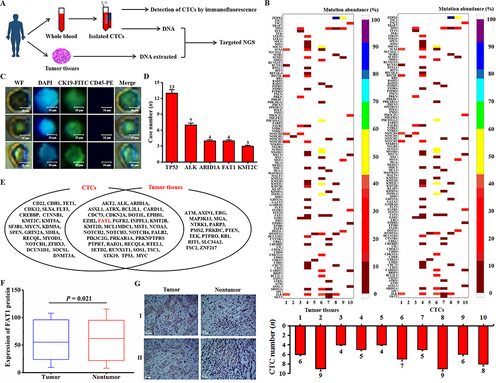
Figure 2 The function of FAT1 affects the proliferation and colony formation of HCC cells. (A) FAT1 mRNA expression and protein level profile in two HCC cell lines were evaluated using RT-PCR and Western blotting. (B) In Hep3B and MHCC97H cells, qPCR was used to determine the knockdown effectiveness of FAT1. (C) The effectiveness of FAT1 overexpression in Hep3B and MHCC97H cells was validated by Western blotting and RT-PCR. (D) Hep3B and MHCC97H cell proliferation are stimulated by FAT1 knockdown. (E) The FAT1-knockdown group had considerably more colonies in HCC cells than the control group. (F) The MTT experiment showed that overexpressing FAT1 prevented Hep3B and MHCC97H cells from proliferating. (G) Hep3B and MHCC97H cell colony formation were inhibited by FAT1 overexpression. All the data obtained is presented in the format of three separate experiments and is expressed as the mean ± standard deviation. **P < 0.01.
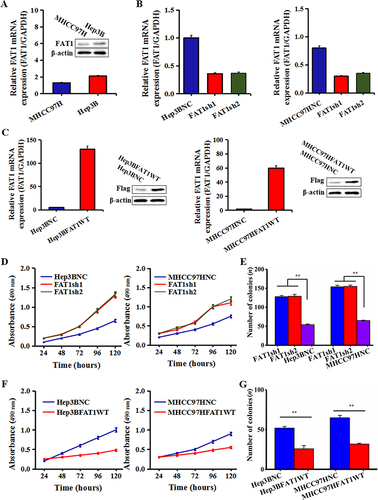
Figure 3 In HCC cells, FAT1 dysregulation of EMT facilitates invasion and migration. (A) Hep3B and MHCC97H cells treated with lentiviruses encoding FAT1-shRNA in transwell migration and invasion studies. Hep3B and MHCC97H cell migration and invasion were markedly enhanced by FAT1 knockdown. (B) A wound healing experiment was used to examine the cell migration of Hep3B and MHCC97H cells treated with lentiviruses encoding FAT1shRNA. (C) FAT1 overexpression decreased cell migration and invasion in co-culture assay tests of Hep3B and MHCC97H cells treated with lentivirus expressing FAT1-WT. (D) RT-PCR was used to determine the relative mRNA levels of E-cadherin, N-cadherin, vimentin, and snail in cells that either overexpressed or knocked down FAT1. GAPDH served as the control. (E) Levels of EMT-related protein were measured using a Western blot assay. Beta (β)-actin served as a control. Independent experiments were repeated at least three times. *P < 0.05, **P < 0.01.
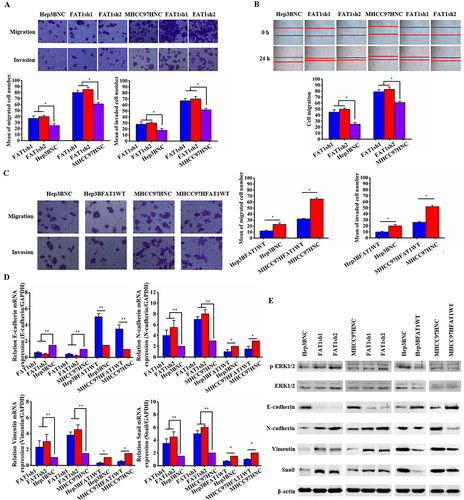
Figure 4 Critical cancer pathway components were altered in FAT1 knockdown cells compared to control cells, as analyzed by RNA sequencing. (A) GSEA of the significantly enriched GO terms indicated that the functional annotation items of crucial genes with differential expression were enriched in focal adhesion, regulation of the immune response process, cell–substrate junction and other aspects. The figure shows the comparison of Hep3BNC and Hep3BFAT1sh. (B) GSEA of the significantly enriched KEGG terms showed that crucial signaling pathways were altered in FAT1 knockdown cells, including the MAPK signaling pathway, the Wnt signaling pathway, the Notch signaling pathway, and the tight junction signaling pathway.
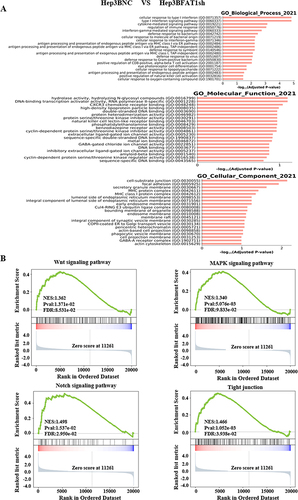
Figure 5 The FAT1-knockdown group promoted the process of EMT in tumor cells through MAPK/ERK signaling pathway. (A) The proliferation of tumor cells in the FAT1-knockdown group treated with U0126 was significantly slowed down. (B) Expression levels of EMT-related proteins were detected in U0126-treated and untreated cells, respectively. (C) Migration and invasion assays of cells in the FAT1 knockdown group treated with U0126. **P < 0.01.
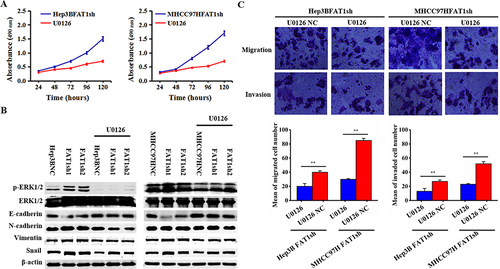
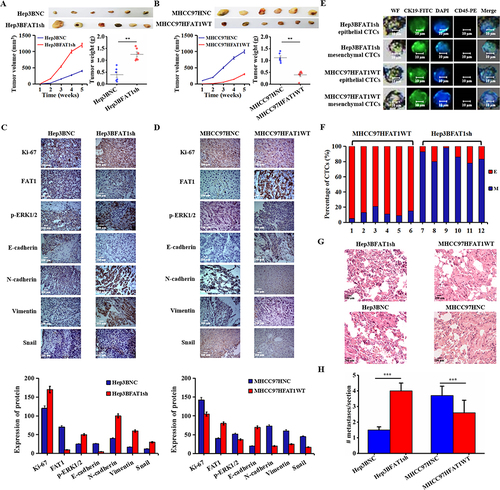
Figure 6 FAT1 knockdown promoted the EMT process and accelerated tumor development in nude mice. (A) FAT1 knockdown promoted tumor growth and significantly increased tumor size (left) and tumor weight (right) in the FAT1 knockdown group compared to the control group. **P < 0.01. (B). Compared with the control group, the tumors in the FAT1-overexpressing group were significantly reduced in size (left) and tumor weight (right). **P < 0.01. (C) Representative IHC staining for Ki-67, FAT1, p-ERK1/2, E-adherin, N-adherin, vimentin and snail from the control group and FAT1 knockdown group (bar, 100 μm). (D) Representative IHC staining for Ki-67, FAT1, p-ERK1/2, E-adherin, N-adherin, vimentin and snail from the control group and FAT1-overexpressing group (bar, 100 μm). (E) Representative CTC images from two groups of mice. (F) ECTC and MCTC count distribution in two groups of mice. (G) Lung metastatic nodules of mice were examined by H&E staining. (H) Average numbers of individual pulmonary metastases. The FAT1-knockdown group had significantly more pulmonary metastases compared to the FAT1-overexpressing group. ***P < 0.001.