Figures & data
Table 1 Clinical Characteristics of the Hepatocellular Carcinoma Patients in the Study
Figure 1 Correlation between preoperative CTC count and platelet count. (A) Distribution of CTCs in the patients with platelet count ≥225×109/L and platelet count <225×109/L. (B) Analysis of the distribution of CTCs in subgroups of patients. ***P < 0.001.
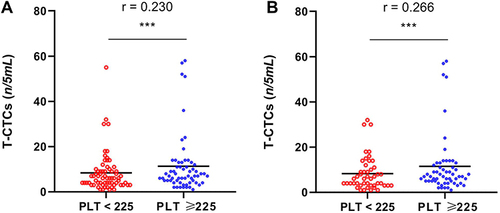
Figure 2 Kaplan–Meier survival curves of early recurrence-free survival (RFS) after liver resection in the patients stratified by preoperative (A) circulating tumor cells (CTCs) and (B) Platelet.
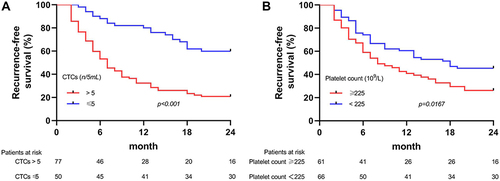
Figure 3 Kaplan–Meier survival curves of early RFS for the subgroup patients stratified by preoperative (A) CTCs and (B) Platelet.
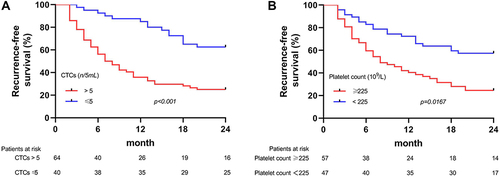
Table 2 Univariate and Multivariate Analyses of Prognostic Factors Associated with the Early Recurrence of HCC
Table 3 Subgroup Univariate and Multivariate Analyses of the Prognostic Factors Associated with the Early Recurrence of HCC
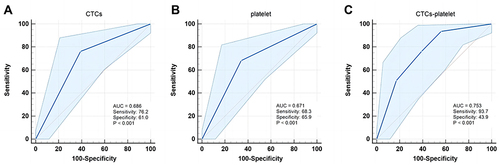
Figure 4 ROC curves for preoperative (A) CTCs, (B) Platelet, and (C) CTCs-platelet to predict the early recurrence of HCC.
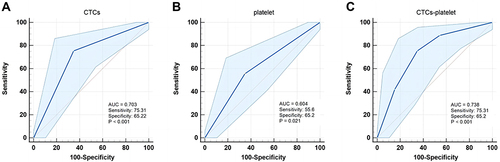
Figure 5 ROC curves of the subgroup patients for the preoperative (A) CTCs, (B) Platelet, and (C) CTCs-platelet to predict the early recurrence of HCC.