Figures & data
Table 1 Baseline Demographics and Clinical Characteristics in All-Patient
Figure 1 The flowchart of the study.
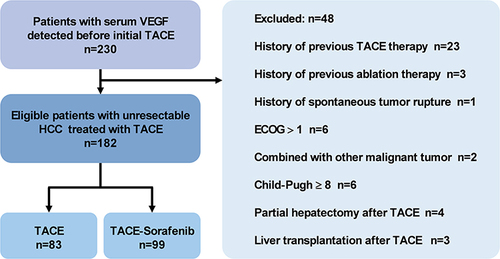
Table 2 Identification of Prognostic Factors for OS in All-Patient, the TACE Group, and the TACE-Sorafenib Group Based on Univariate Cox Regression
Table 3 Identification of Independent Prognostic Factors for OS in All-Patient, the TACE Group, and the TACE-Sorafenib Group Based on Multivariate Cox Regression
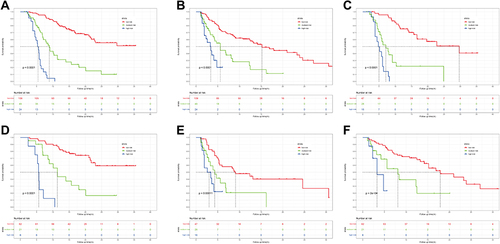
Figure 2 Kaplan–Meier curves for OS and PFS in HCC patients with high and low baseline serum VEGF. OS curves in (A) all-patient, (B) the TACE group, and (C) the TACE-Sorafenib group. PFS curves in (D) all-patient, (E) the TACE-Sorafenib group, and (F) the TACE group.
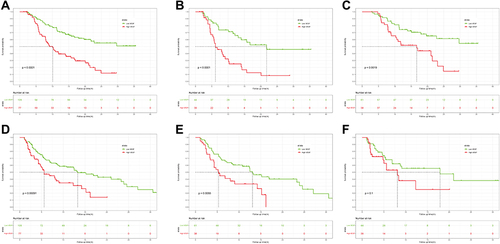
Figure 3 The association between VEGF, ALP, NLR, and relative hazard and variable screening by Lasso. The restricted cubic splines of (A)VEGF, (B) ALP, and (C) NLR in all-patient. (D) and (E) LASSO regression analysis identified variables screened into the VEGF-associated model.
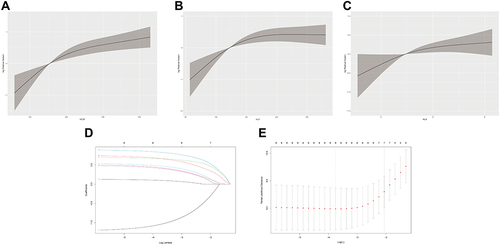
Table 4 Variables Included in the Final Model After LASSO Regression Analysis
Figure 4 The prognostic nomogram constructed from all-patient to predict OS of unresectable HCC patients. The sum of the points corresponding to each variable (total points) was used to predict the likelihood of an individual patient’s 6-month, 1-year, or 2-year survival.
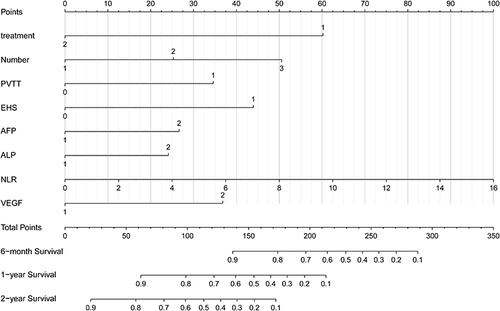
Figure 5 The performance of the final model for predicting OS. The calibration curve of the model for predicting (A) 6-month, (B)1-year, and (C) 2-year OS. (D) the time-independent ROC curve of the model for predicting 6-month, 1-year, and 2-year OS.
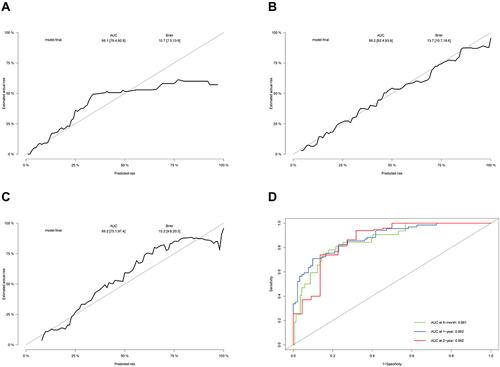
Table 5 Comparison of the Predictive Power Between the Different Model
Figure 6 The time-independent ROC curves of other models for predicting 6-month, 1-year, and 2-year OS and decision curve analysis (DCA). The time-independent ROC curves of (A) CNLC stage, (B) AJCC stage, (C) BCLC stage, and (D) the model without “VEGF”. The DCA of the five models for predicting (E) 6-month, (F)1-year, and (G) 2-year OS.
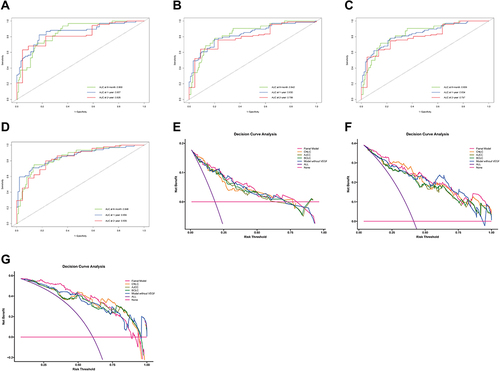
Figure 7 Kaplan–Meier curves of the final model stratification. (A) OS of all patients was stratified by the model stratification. (B) PFS of all patients was stratified by the model stratification. OS of patients with (C) age ≤55 and (D) age >55 was stratified by the model stratification. PFS of patients with (E) age ≤55 and (F) age >55 was stratified by the model stratification.