
Figures & data
Figure 1 ULK1 is overexpressed in HCC tissues and cell lines. (A) Data from TCGA showing normalized mRNA expression of ULK1 in liver cancer tissues and normal tissues. ***P < 0.001. (B) Comparison of normalized mRNA level among stage I HCC, stage II and stage (III–IV) HCC samples. (C) Protein expression of ULK1 in HCC tissues and adjacent non-tumor tissues was detected by immunoblot. (D) ULK1 expression in human cancer cell lines originating from different tissues or organs was analyzed using online tool CCLE.
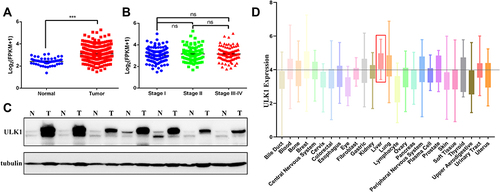
Figure 2 ULK1 depletion promotes apoptosis and inhibits proliferation of HCC cells. (A) ULK1 protein expression levels in three liver cancer cell lines and normal liver cell line HL7702 were examined by Western blot. (B) ULK1 protein expression was analyzed by immunoblotting 72 h after transfection with siRNAs in Huh-7 cells. (C) Down-regulation of ULK1 by siRNA inhibited proliferation of Huh-7 cells. *P < 0.05. (D) Representative images of changed cellular morphology 96 h after siRNA transfection. (E) The effects of ULK1 down-regulation on apoptosis-related proteins. (F) Quantification results of apoptosis-related proteins. Colony formation (G) and quantification (H) of colonies for Huh-7 cells post-transfection with siULK1s or scramble controls. *, #P < 0.05, **, ##P < 0.01, ***P < 0.001 vs scramble control cells.
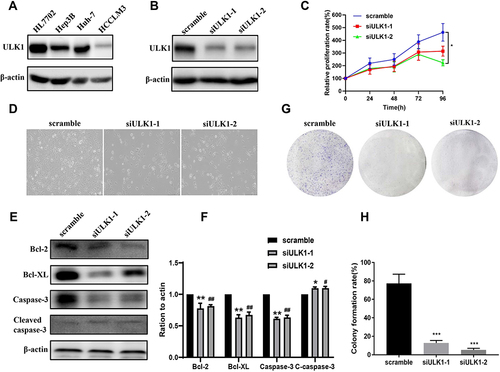
Figure 3 RNA-sequencing analysis of transcriptional signatures in Ulk1KO mice liver. (A) Heatmap of differentially expressed genes in Ulk1KO mice liver compared with WT mice. Gene set enrichment analysis identified positively related pathways (B) and negatively related pathways (C) in Ulk1KO mice versus WT mice.
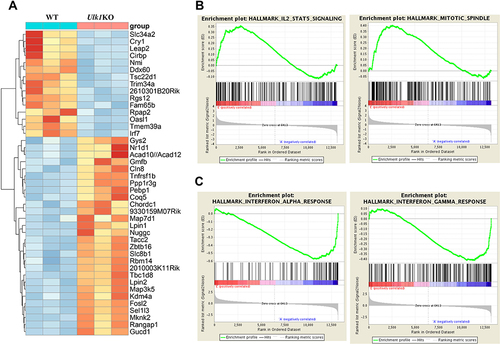
Figure 4 Comparison of basal and starvation-induced autophagy in liver of Ulk1KO and WT mice. Wild-type (A) and Ulk1KO (B) mice were treated as indicated, then lysates of liver were collected and subjected to immunoblotting to detect autophagic marker LC3. (C). Measurement of LC3-II/LC3-I band density ratio. *P < 0.05 vs control of WT mice.
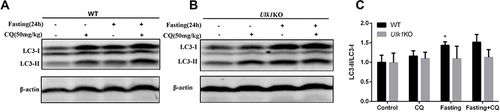
Figure 5 Ulk1 deficiency prevents DEN-induced HCC. (A) Representative macroscopic images and HE-stained liver sections of mice from different groups at 32 weeks of age [scale bar, 1 cm, 100 μm (100×), 20 μm (400×)]. (B) Numbers of macroscopically detectable nodules at the liver surface in DEN-treated WT and Ulk1KO mice. n = 7 to 12, ***P < 0.001. (C) Tumor incidence in DEN-treated WT and Ulk1KO mice, statistical analysis was conducted using Fisher’s exact test (n = 7 to 12). (D) Percentage of mice with foci, hyperplasia, HCA, and HCC in WT and Ulk1KO mice. Statistical analysis was conducted using the Mann–Whitney U-tests (n = 7 to 12), *P < 0.05. The maximal diameters (E) and accumulated diameters (F) of tumors per mouse were measured (n = 7 to 12), **P < 0.01. ***P < 0.001.
![Figure 5 Ulk1 deficiency prevents DEN-induced HCC. (A) Representative macroscopic images and HE-stained liver sections of mice from different groups at 32 weeks of age [scale bar, 1 cm, 100 μm (100×), 20 μm (400×)]. (B) Numbers of macroscopically detectable nodules at the liver surface in DEN-treated WT and Ulk1KO mice. n = 7 to 12, ***P < 0.001. (C) Tumor incidence in DEN-treated WT and Ulk1KO mice, statistical analysis was conducted using Fisher’s exact test (n = 7 to 12). (D) Percentage of mice with foci, hyperplasia, HCA, and HCC in WT and Ulk1KO mice. Statistical analysis was conducted using the Mann–Whitney U-tests (n = 7 to 12), *P < 0.05. The maximal diameters (E) and accumulated diameters (F) of tumors per mouse were measured (n = 7 to 12), **P < 0.01. ***P < 0.001.](/cms/asset/9ffd3a51-665e-4b9a-ba3a-e9099c349735/djhc_a_12155770_f0005_c.jpg)