
Figures & data
Figure 1 Flow diagram showed selection criteria.
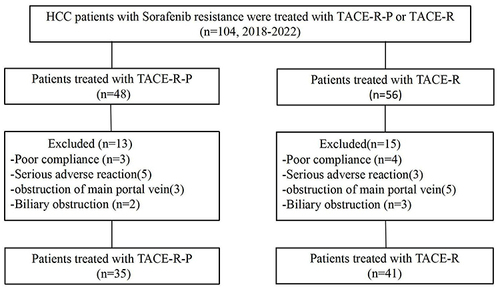
Table 1 Baseline Demographic and Clinical Characteristics of Patients Enrolled in This Study
Table 2 Tumor Response in Patients to TACE-R-P Group and TACE-R Group
Figure 2 Kaplan–Meier curves of OS (A) and PFS (B) according to TACE-R-P and TACE-R groups.
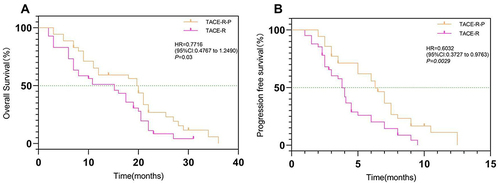
Figure 3 (A) Contrast-enhanced MRI showed HCC progression after sorafenib resistance; (B) In patients undergoing TACE, the staining of HCC was obvious; (C) The staining of HCC disappeared after TACE treatment; (D) Eight months after TACE-R-P treatment, contrast-enhanced MRI showed necrosis in most lesions, and tumor response was assessed as PR.
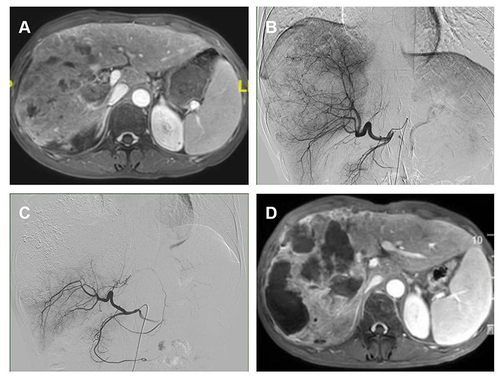
Figure 4 (A) Contrast-enhanced MRI showed HCC progression after sorafenib resistance; (B) In patients undergoing TACE, the staining of HCC was obvious; (C) The staining of HCC disappeared after TACE treatment; (D) Two months after TACE-R treatment, contrast-enhanced MRI showed HCC progression, and tumor response was assessed as PD.
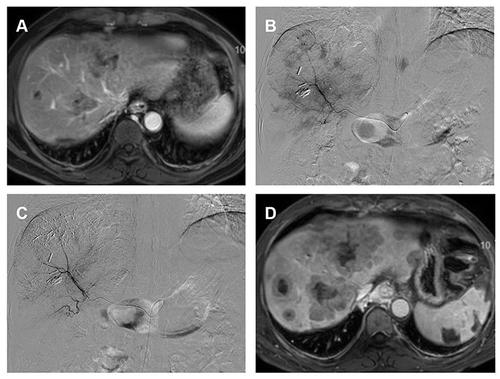
Table 3 Univariate and Multivariate Analyses of Risk Factors for OS in HCC Cases After Sorafenib Resistance
Table 4 Treatment-Related Adverse Events in Two Groups