Figures & data
Figure 1 The flow chart is illustrated.
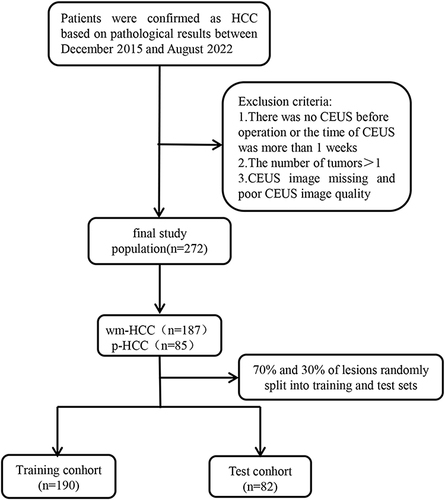
Figure 2 The flow chart of CEUS-base DLR analysis for predicting differentiation of HCC is shown.
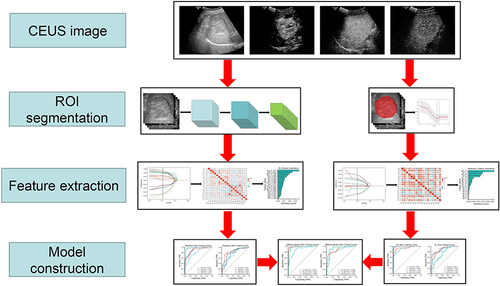
Table 1 Patients and Baseline Characteristics
Table 2 Performance of the Three Models
Figure 3 Selection of significant parameters in features in the training set. (A) Spearman correlation coefficients were calculated for the 17 selected features in Radiomics model. (B) Spearman correlation coefficients were calculated for the 19 selected features in DL model.
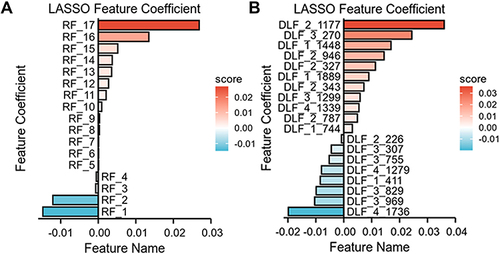
Figure 4 The definition of the linear predictor in the training set. (A) Characters classification weight of the features in Radiomics model. (B) Characters classification weight of the features in DL model.
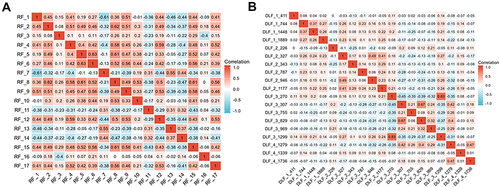
Figure 5 The AUC of radiomics model, DL model and DLR model in training cohort and testing cohort. (A and B) the AUC of Radiomics models in training and testing cohorts are 0.887 and 0.848. (C and D) the AUC of DL models in training and testing cohorts are 0.994 and 0.897. (E and F) the AUC of DLR models in training and testing cohorts are 0.969 and 0.932.
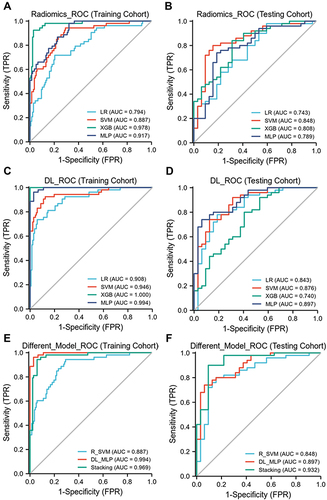
Figure 6 The decision curve analysis for the DLR model. (A) The decision curve analysis in the training cohort. (B) The decision curve analysis in the testing cohort.
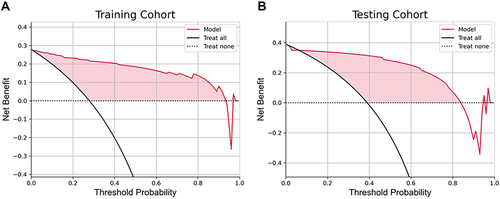
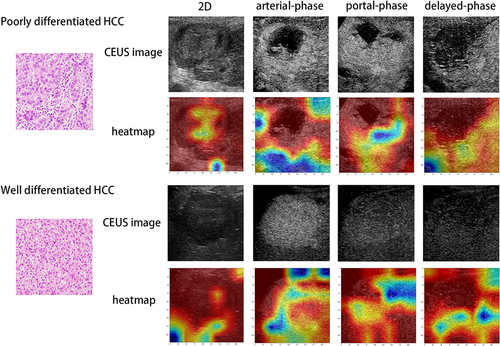
Figure 7 Visualization of two patient examples. CEUS and heatmap of poor-differentiation patients in the first and second rows, while CEUS and heatmap of well - differentiation patients in the third and fourth rows. The first to fourth columns are two-dimensional ultrasound, arterial-phase, portal-phase and delayed-phase. Red highlights the active regions associated with poorly differentiated differentiation.