Figures & data
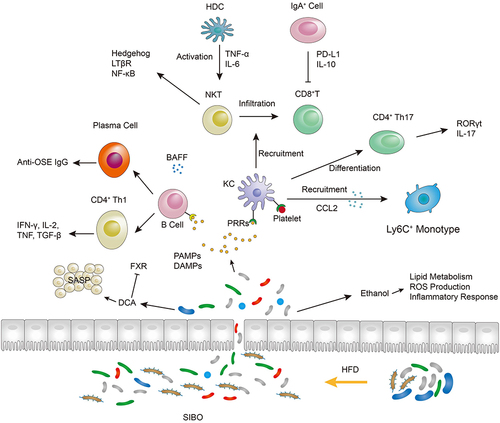
Figure 1 Molecular signaling pathways of insulin resistance in hepatocarcinogenesis. Activation of downstream signaling pathways is indicated by lines ending with arrows whereas inhibition of them is indicated by blunted lines.
Abbreviations: IR, insulin receptor; IGF-1, insulin growth factor-1; IGF1R, insulin-like growth factor-1 receptor; IRS-1, insulin receptor substrate-1; TNF-α, tumor necrosis factor-α; IL-6, interleukin-6; PIP2, phosphatidylinositol-3.4-bisphosphate; PIP3, phosphatidylinositol-3.4.5-triphosphate; PI3K, phosphoinositide 3-kinases; mTOR, mammalian target of rapamycin; PTEN, phosphatase and tensin homologue on chromosome 10 gene; MAPK, mitogen-activated protein kinase.
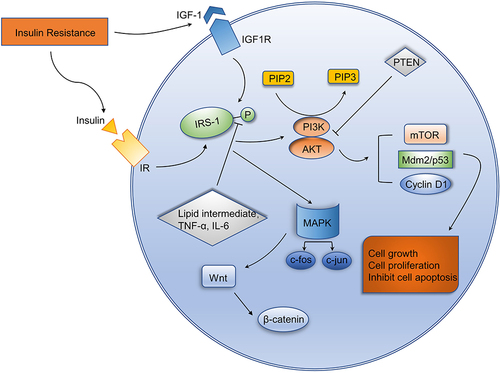
Figure 2 Mechanism of lipid accumulation and oxidative stress in liver tumorigenesis. Long lines ending with arrows or bars indicate activating or inhibitory effects respectively. Short arrows pointing up or down indicate up-regulated or down-regulated.
Abbreviations: FFA, free fatty acid; ROS, reactive oxygen species; ER, endoplasmic reticulum; RIP, receptor interacting protein; MLKL, mixed lineage kinase domain-like protein; TNF-α, tumor necrosis factor-α; IL-6, interleukin-6; JAK20, Janus kinase 2; JNK, Jun-(N)-terminal kinase; IKKβ, IκB kinase-β; STAT3, signal transducer and activator of transcription 3; PI3K, phosphoinositide 3-kinases; MAPK, mitogen-activated protein kinase; ADP, adiponectin; DDR, DNA damage response.
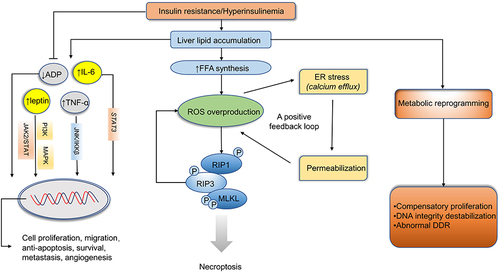
Figure 3 The role of intestinal microbiota dysbiosis and inflammatory response in hepatocarcinogenesis. Lines with arrows or bars are used to indicate facilitation or inhibition.
Abbreviations: HFD, high-fat diet; SIBO, small intestinal bacterial overgrowth; DCA, deoxycholic acid; SASP, senescence-associated secretory phenotype; FXR, farnesol X receptor; PAMPs, pathogen-associated molecular patterns; DAMPs, damage-associated molecular patterns; PRRs, pattern recognition receptors; KC, Kupffer cell; NKT, natural killer T; TNF, tumor necrosis factor; IL-6, interleukin-6; TGF, transforming growth factor; IFN-γ, interferon-γ; CCL2, C-C motif chemokine ligand 2; HDC, hepatic dendritic cell; BAFF, B cell activating factor.