
Figures & data
Figure 1 The expression profile, PPI network, and functional enrichment of GRGs in HCC. (A) Venn plot of the Common GRGs (n = 108) both in the TCGA and GSE14520 datasets. (B and C) Volcano plot and heatmap of the differentially expressed GRGs in HCC from the TCGA dataset. (D) PPI network of the differentially expressed GRGs in HCC. (E) Top 25 differentially expressed GRGs based on the number of adjacent nodes. (F) Top 10 core GRGs based on the “cytoHubba” algorithm. (G and H) GO and KEGG enrichment analyses of the differentially expressed GRGs in HCC.
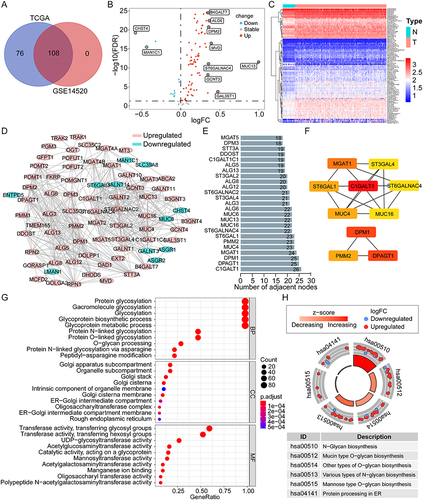
Figure 2 Construction and evaluation of the novel prognostic risk score model based on the GRGs in HCC. (A) Univariate Cox analysis of the differentially expressed GRGs for OS of HCC in the TCGA cohort. (B and C) Lasso Cox analysis to identify the critical GRGs for the construction of risk score model in the TCGA training group. Survival curves and the 1-, 3-, and 5-year ROC curves of high- and low-risk patients in the TCGA training group (D and E), the TCGA validation group (F and G), the TCGA overall cohort (H and I), and the GSE14520 cohort (J and K).
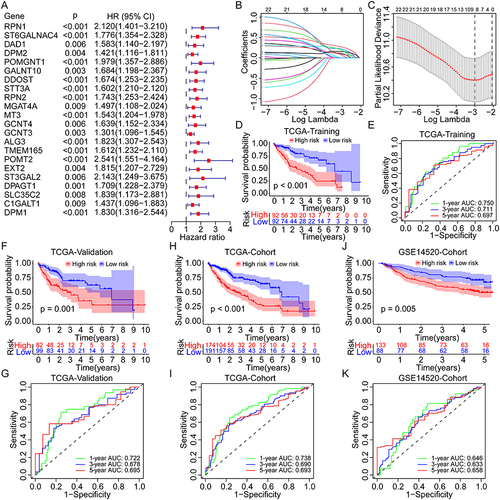
Figure 3 Distribution of the risk score, survival status, and GRGs expression in different cohorts. (A–D) Percentages of different survival status in high- and low-risk patients in the TCGA training group, the TCGA validation group, the TCGA overall cohort, and the GSE14520 cohort. (E–H) Distribution of the risk score, survival status, and GRGs’ expression in the TCGA training group, the TCGA validation group, the TCGA overall cohort, and the GSE14520 cohort. (I–L) PCA analysis for the distribution of high- and low-risk patients in the TCGA training group, the TCGA validation group, the TCGA overall cohort, and the GSE14520 cohort.
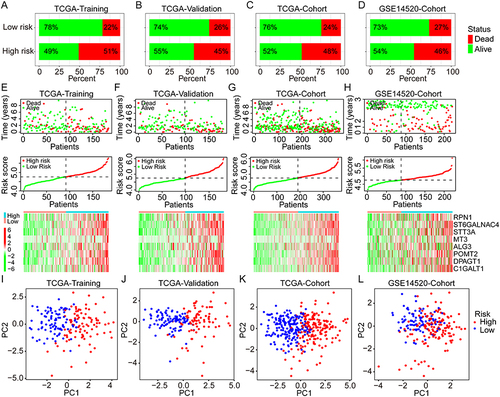
Figure 4 Univariate and multivariate Cox analyses for the development of a prognostic nomogram for OS prediction in HCC. (A–D) Univariate and multivariate Cox analyses for OS of HCC in the TCGA training group, the TCGA validation group, the TCGA overall cohort, and the GSE14520 cohort. (E) Establishment of a prognostic nomogram based on the risk score and clinical stage for OS prediction of HCC. (F and G) Calibration curves for evaluation of the prognostic accuracy of the nomograms for the TCGA and GSE14520 cohorts.
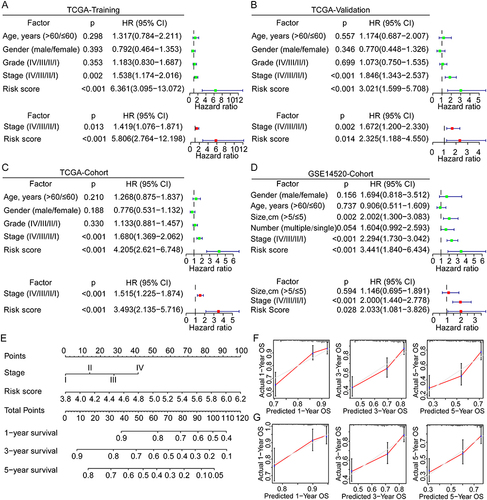
Figure 5 Correlation and subgroup survival analyses of the risk score and clinical characteristics in HCC. (A and B) Risk score in different subgroups divided by various clinical factors in the TCGA and GSE14520 cohorts. (C and D) Survival curves of the high- and low-risk patients in different subgroups of the TCGA and GSE14520 cohorts.
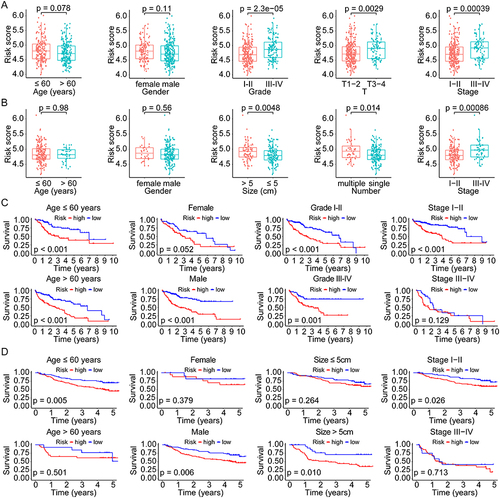
Figure 6 GSEA, ssGSEA, and immunological correlation analyses of different risk scores in HCC. (A and B) Enriched pathways in high- and low-risk groups of HCC by GSEA analysis. (C and D) Differential analyses of the immune status and function in high- and low-risk groups by ssGSEA analysis. (E) Correlation analyses between the risk scores and the infiltration levels of various immune cells in HCC. (F) The distribution of risk scores in different immune subtypes of HCC. ns not significant, *p < 0.05, **p < 0.01, ***p < 0.001.
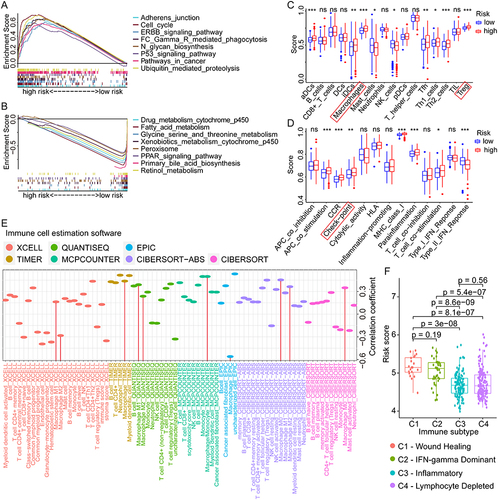
Figure 7 Correlation analyses between the risk scores, GRGs, and the immune checkpoint genes in HCC. (A) Differential expressions of immune checkpoint genes in high- and low-risk groups of HCC. (B) Correlation analyses between risk scores and the multiple immune checkpoint gene expressions in HCC. (C) Correlation analyses between the expressions of GRGs and immune checkpoint genes in HCC. (D) Correlation dot plots of ST6GALNAC4 with multiple immune checkpoint genes in HCC from the TIMER database. (E) Correlation dot plots of B7-H3 with GRGs from the TIMER database.
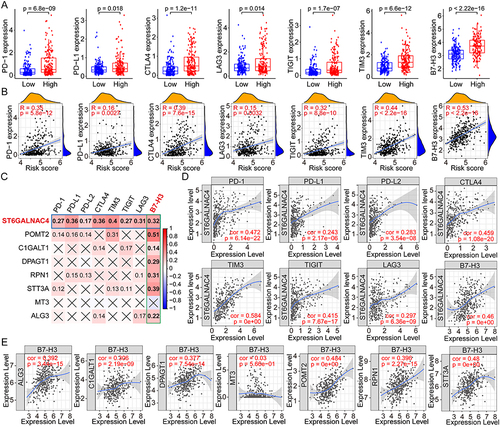
Figure 8 Correlation analyses between the risk scores and the drug susceptibilities of HCC. (A) The IC50s of various drugs to HCC in high- and low-risk groups using the GDSC data for analyses. (B) Correlation analyses between the GRGs’ expression and the NCI60-Z scores of various drugs in HCC using the Cellminer data. (C) Representative dot plots showing the correlation between GRGs and drugs with significant coefficients.
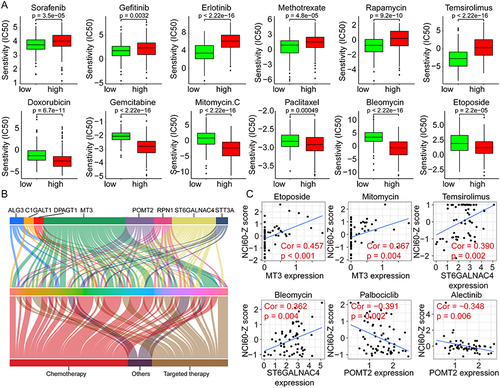
Figure 9 Validation of ST6GALNAC4 expression in HCC tissues and its correlation with immune checkpoints. (A) Expression profile of ST6GALNAC4 in 47 HCC tissues compared to paracan-cerous tissues. (B) The mean expression level of ST6GALNAC4 in 47 paired HCC and paracan-cerous tissues (**p < 0.01). (C) The relative expression distribution of ST6GALNAC4, PD-L1, and B7-H3 in HCC tissues. (D) Correlation analyses of ST6GALNAC4 expression with PD-L1 and B7-H3 in HCC tissues. (E) Western blot analysis for ST6GALNAC4 protein expression in HCC and paracancerous tissues.
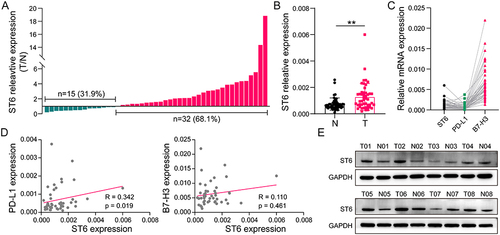
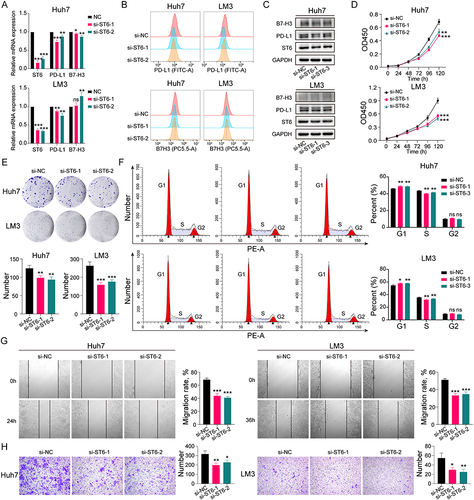
Figure 10 Effect of ST6GALNAC4 knockdown on hepatoma cells. (A) Expression of PD-L1 and B7-H3 mRNA in hepatoma cells after ST6GALNAC4 knockdown. (B and C) Flow cytometric and Western blot analyses of PD-L1 and B7-H3 expression in hepatoma cells after ST6GALNAC4 knockdown. (D) CCK-8 analysis of the effect of ST6GALNAC4 knockdown on the proliferative capacity of hepatoma cells. (E and F) Effect of ST6GALNAC4 knockdown on the clone formation ability and cell cycle of hepatoma cells. (G and H) ST6GALNAC4 knockdown inhibited the migration and invasion ability of hepatoma cells. ns not significant, *p < 0.05, **p < 0.01, ***p < 0.001.
Data Sharing Statement
All data used in this study were acquired from The Cancer Genome Atlas (TCGA) and the Gene Expression Omnibus (GEO) portal.