Figures & data
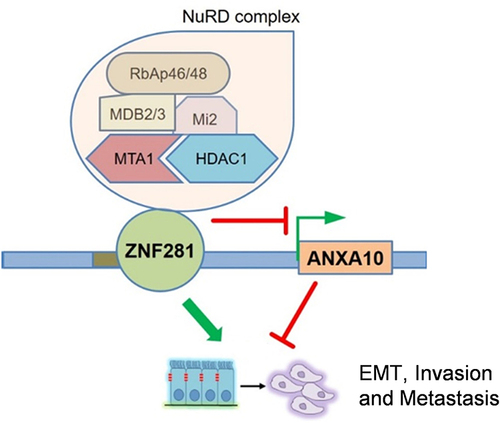
Table 1 siRNAs Targeting ZNF281 and ANXA10
Table 2 Primers Used for RT-qPCR Reaction
Table 3 The Correlation Between ZNF281 Expression and Clinicopathological Characteristics in HCC Tissue Microarray (90 Samples)
Figure 1 ZNF281 was increased expression in hepatocellular carcinoma (HCC). (A) Immunohistochemistry of ZNF281 in HCC tissues in comparison with corresponding paracancerous tissues (left: 4×, right: 20× objective). (B) Quantification from A (n=3; **p < 0.01). (C) Comparison of mRNA level of ZNF281 from HCC and corresponding paracancerous tissues of 14 HCC patients. (D) Comparison of ZNF281 mRNA level between HCC patients and the non-cancer control in the TCGA liver cancer and the GTEx datasets. (E) Comparison of ZNF281 mRNA level between HCC patients and normal control of Chen’s liver in the Oncomine database. (F) Protein level of ZNF281 in commonly used normal liver or HCC cell lines.
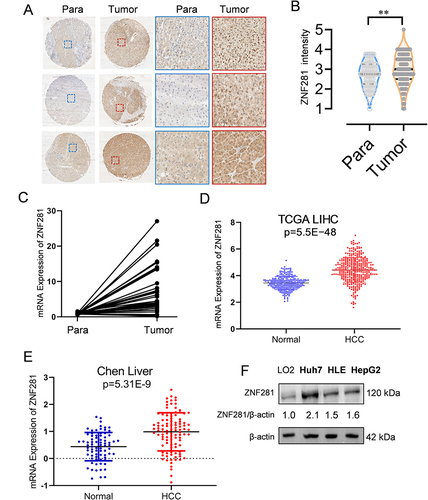
Figure 2 Knockdown of ZNF281 inhibited migration and invasion in HCC cells with retardation of EMT. (A) Western blot of ZNF281 in shRNA (ZNF281.kd1 or ZNF281.kd2) stably infected HLE or Huh7 cells. (B and C) Wound healing assays (10×) in ZNF281 knockdown HLE or Huh7 cells. (D and E) Quantification from (B) and (C) were shown in mean ± SEM (n=3; **p < 0.01, and ***p < 0.001). (F and G) Matrigel transwell assays (20×) in ZNF281 knockdown HLE and Huh7 stable cells. (H and I) Quantification (n=3; **p < 0.01) from (F and G). (J and K) The mRNA levels of EMT markers were determined by RT-qPCR (n=3; *p < 0.05, **p < 0.01 and ***p < 0.001). (L) Representative phase contrast (P/C) pictures of HLE cells transfected with shRNAs against ZNF281. Bar= 100 μm. (M) Immunofluorescence observed under confocal microscopy of mesenchymal marker Vimentin and epithelial marker ZO-1 in HLE cells following ZNF281 depletion with ZNF281.kd1. (bar=10 μm).
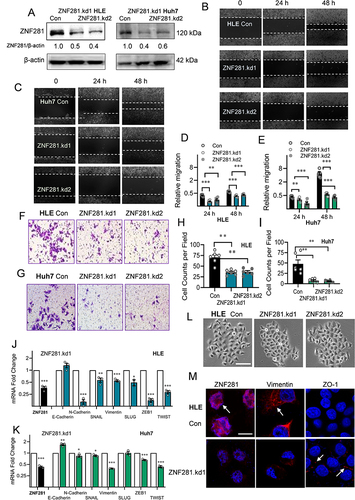
Figure 3 RNA-seq screening for potential targets of ZNF281 in HCC cells. (A and B) Bioinformatic analyses of down-regulated (B) or up-regulated (C) genes upon ZNF281 with Metascape online tools. (C) Identification of ANXA10 from the heatmap including top 40 DEGs. (D and E) Validation by RT-qPCR of selected DEGs in stable shZNF281 expressing HLE or Huh7 cells. (F) Western blotting confirmation of ZNF281 and ANXA10 expression in HLE cells with stable depletion of ZNF281. (G) Immunofluorescence for ZNF281 and ANXA10in HLE or Huh7 cells following ZNF281 depletion (bar=25 μm).
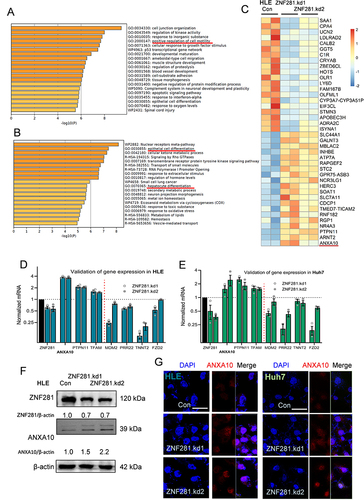
Figure 4 ZNF281 directly regulated ANXA10 transcription involving the recruitment of NuRD complex. (A) Illustration of ANXA10 promoter region containing implicated ZNF281 binding site for ChIP analyses. Primers for the target region are indicated by triangular arrows. Red line represents the PCR amplified product. (B and C) upper panels: ChIP assays followed with agarose electrophoresis to show specific binding of ZNF281 on ANXA10 promoter as indicated in (A). M: marker; lower panels: Quantitative ChIP-PCR demonstrating the enrichment of ZNF281 at ANXA10 promoter in Huh7 cells. *p < 0.05, ***p < 0.001. (D) Co-IP for the interaction of ZNF281 with indicated components of NuRD complex in HLE cells. (E and F) Immunofluorescence for colocalization of ZNF281 with HDAC1 (E) and MTA1 (F) in HCC cells. Bar=25μm. (G) Western blotting for ANXA10 following HDAC1 siRNA transfection in HLE cells. (H) Effect of MTA1 RNAi on ANXA10 at the protein level in Huh7 cells. (I and J) RT-qPCR analyses of ANXA10, ZNF281, HDAC1 and MTA1 in HDAC1 (I) or MTA1 (J) knockdown HLE cells (n=3; *p < 0.05, **p < 0.01 and ***p < 0.001).
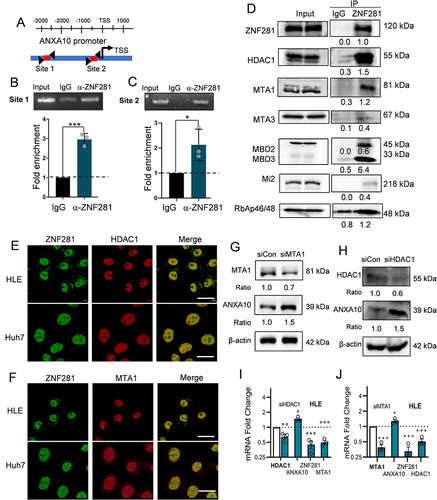
Figure 5 Knockdown of ANXA10 attenuated the effect of ZNF281 depletion on inhibiting migration, invasion and metastasis of HCC cells. (A) Western blot for ANXA10 expression upon ANXA10 depletion in ZNF281kd.1 HCC cells. (B and C) Wound healing assays (10×) in ZNF281kd.1 HLE or Huh7 cells subjected to ANXA10 siRNA. (D and E) Quantification of (B and C) as mean ± SEM (n=3; *p < 0.05, ***p < 0.001). (F and G) Matrigel transwell assays (4×) in ZNF281 knockdown HLE and Huh7 cells transfected with scramble control or ANXA10 siRNA. The quantification was shown in the right panel (n=3; ***p < 0.001). (H) Expression of ANXA10 in HLE cells with different shRNA transfection as indicated. (I) Resected lungs for indicated groups. Arrows indicated the pulmonary metastatic nodules with macroscopic observation. (J) Statistical analysis of the pulmonary nodules in different groups as indicated (*p < 0.05, ***p < 0.001). (K and M) Representative images of HE staining for the resected lungs. Scale bars: 500 μm.
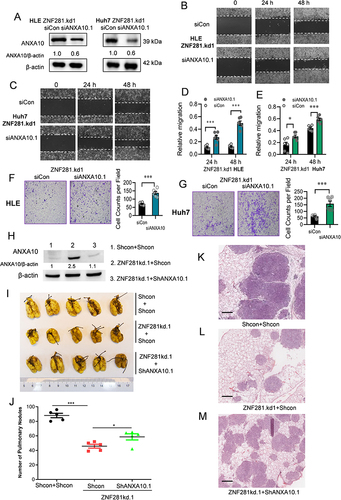
Figure 6 ANXA10 inhibited the migration and invasion with suppressed expression of EMT markers in HCC cells. (A) ANXA10 protein levels in HLE cells transfected with siRNAs against ANXA10 (siANXA10.1 and siANXA10.2) or ANXA10 overexpression plasmid. (B and C) Microscopic fields (10×) from wound healing assays in ANXA10 knockdown or ANXA10 overexpression HLE cells. (D and E) Quantification of (B and C) plotted as mean ± SEM (n=3; **p < 0.01 and ***p < 0.001). (F and G) Matrigel transwell assays (4×) in HLE cells with ANXA10 knockdown or overexpression. (H and I) Quantification of (F) and (G) (n=3; **p < 0.01, and ***p < 0.001). (J and K) Normalized mRNA levels of EMT markers in ANXA10 knockdown or overexpression HLE cells by RT-qPCR (n=3; *p < 0.05, **p < 0.01, and ***p < 0.001). (l) Immunofluorescence of Vimentin in HLE with ANXA10 overexpression (bar=10 μm).
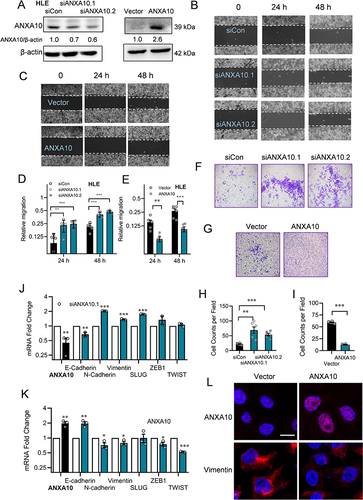
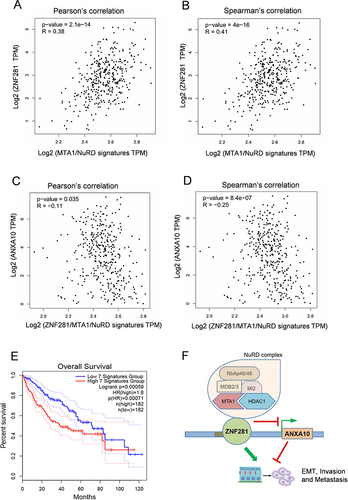
Figure 7 Expression of ANXA10 showed negative correlation with that of ZNF281/MTA1/NuRD complex. (A and B) Correlation of mRNA expression between ZNF281 and MTA1/NuRD signature that includes MTA1, HDAC1, CHD4, MBD2, MBD3 and HDAC2 in TCGA liver cancer database. (C and D) Correlation of mRNA expression between ANXA10 with ZNF281/MTA1/NuRD signature that includes ZNF281, MTA1, HDAC1, CHD4, MBD2, MBD3 and HDAC2 in TCGA liver cancer database. (E) Overall survival analysis with high and low expression of ZNF281/MTA1/NuRD signature in the TCGA liver cancer database. The 7 signatures mean the ZNF281/MTA1/NuRD signature mentioned above. (F) Proposed model demonstrating the regulation of ZNF281/MTA1/NuRD complex and ANXA10 on aggressiveness in HCC.