Figures & data
Table 1 Antibodies Applied in Western Blot, Immunohistochemistry, Immunofluorescence and Flow Cytometry
Figure 1 (A) The proportion of apoptotic cells in lenvatinib-treated cells was higher than that in the control group. (B) Extracellular ATP was significantly increased after treatment of lenvatinib and intracellular ATP was decreased or remained constant. (C) Lenvatinib significantly increased calreticulin expression on the surface of all hepatoma cells. (D) Elisa and Western blot analyses revealed higher HMGB1 in the culture medium of lenvatinib-treated hepatoma cells than that in untreated cells. *p < 0.05, **p < 0.01, *** p <0.001.
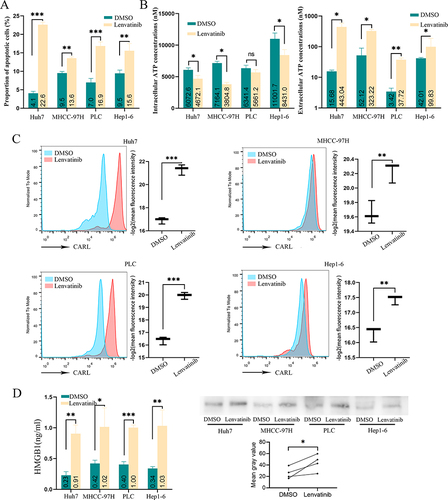
Figure 2 (A) GO and KEGG pathway analysis of increased genes after lenvatinib treatment. (B and C) Volcano plot showing differential expressed genes between lenvatinib-treated and untreated Huh7 cells and MHCC-97h cells. The TLR3 and TLR4 was listed in arrow heads.
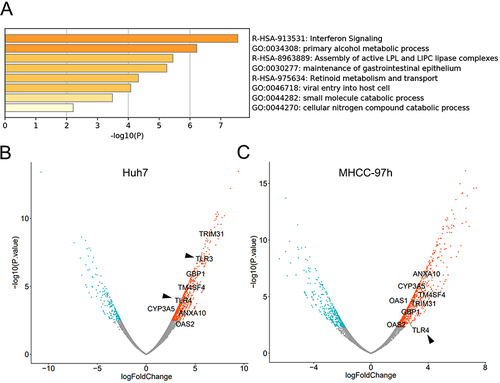
Figure 3 After treatment with lenvatinib for 2 weeks, both the mRNA expression(A) and protein expression (B and C) of TLR3 was significantly increased. Moreover, the mRNA (D) and protein (E) expression of TLR4 were also upregulated. *p < 0.05, **p < 0.01.
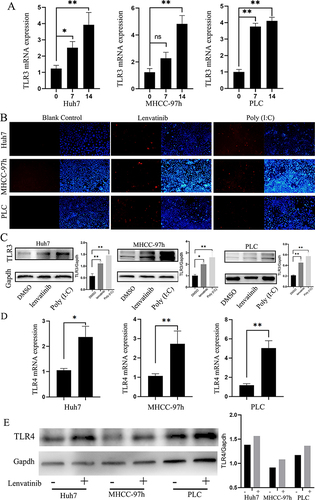
Figure 4 Tumor size was significantly decreased after lenvatinib treatment (A and B). Western blot and IHC showed that protein expression of TLR3 (C and D) and TLR4 (E and F) were also increased in vivo. **p < 0.01.
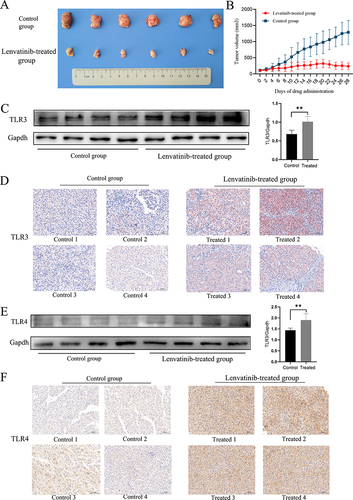
Figure 5 (A) TCGA database revealed a strong correlation between TLR3/TLR4 and CD274. (B) PD-L1 expression was significantly increased after two weeks lenvatinib treatment and decreased after the inhibition of TLR4. (C) The inhibition of TLR3 had not significantly affected PD-L1 expression. *p < 0.05, **p < 0.01, *** p <0.001.
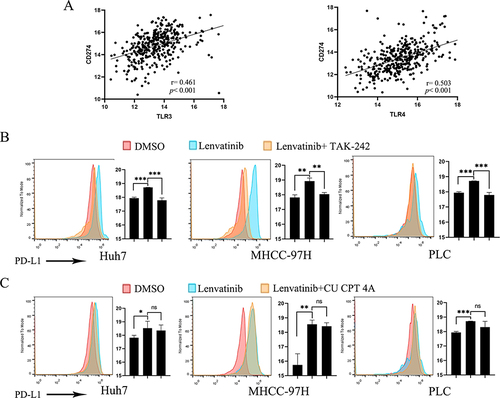
Figure 6 (A) The inhibition of TLR3 decreased the proportions of apoptotic cells. (B) CCK8 assay indicated that inhibition of TLR3 reinforced the proliferative capacity of MHCC-97H and Huh7 cells (B and C). *p < 0.05, **p < 0.01, *** p <0.001.
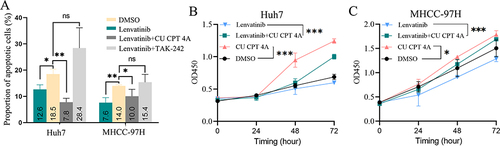
Table 2 Univariate and Multivariate Analysis of Overall Survival and Recurrence-Free Survival
Table 3 Clinic Baseline and Correlation Analysis with TLR3 or TLR4
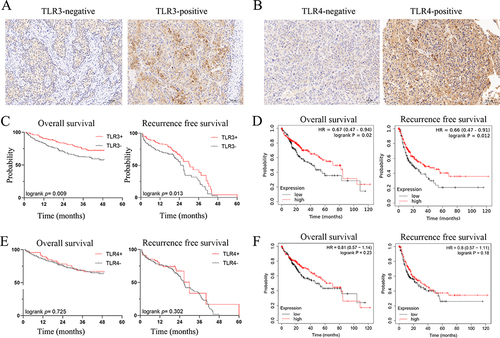
Figure 7 (A) Representative images of TLR3 in hepatocellular carcinoma (HCC). (B) Representative images of TLR4 in HCC. (C) Kaplan–Meier estimates overall survival (OS) and recurrence-free survival (RFS) according to TLR3 expression in HCC patients. TLR3-positive patients had a better prognosis than TLR3-negative patients. (D) Data from TCGA database showed higher TLR3 mRNA levels in HCC was positively associated with OS and RFS. (E) Kaplan–Meier estimates for OS and RFS according to TLR4 expression in HCC patients. TLR4 expression was not associated with prognosis. (F) Data from TCGA database showed higher TLR4 mRNA levels was not associated with prognosis in HCC.