Figures & data
Figure 1 Co-expression network construction. (A). Clustering dendrogram of samples. (B). The scale-free fit index for soft-thresholding powers of 1–20 and the mean connectivity for 1–20 soft-thresholding powers. (C). Gene clustering dendrogram generated based on topological overlap matrix. (D). Modules clustering dendrogram based on correlations of module eigengenes.
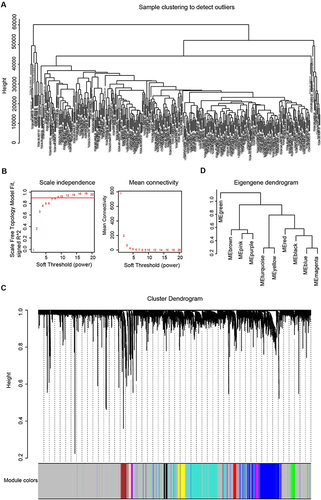
Figure 2 Identification of the hub gene. (A). Heatmap of correlations of module eigengenes with clinical traits. Each row represented a gene module and each column represented a clinical trait, and each cell showed the correlation and P value. The table was color-coded by correlation according to the color legend. (B). Scatterplots of absolute gene significance (GS) for tumor stage vs absolute module membership (MM) in the turquoise module. (C). Top 30 gene networks of the turquoise module. The genes were selected according to the degree. The redder the color, the higher the degree. (D). The expression level of hnRNPA1 in tumor (n = 374) and non-tumor tissues (n = 50). Data are expressed as the means ± SD, ****P < 0.0001. (E). Kaplan-Meier survival analysis of hnRNPA1 gene.
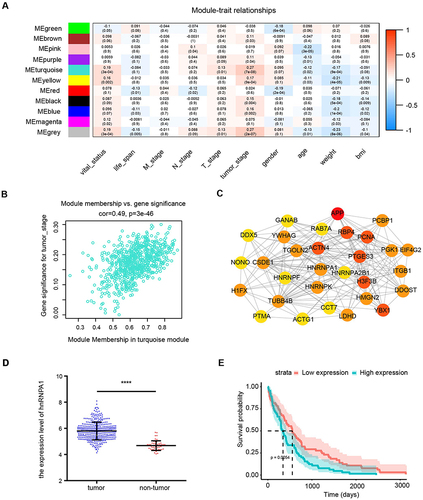
Table 1 Correlation Between Clinicopathological Features and hnRNPA1 Expression Levels of HCC Patients
Figure 3 Expression of hnRNPA1 in human hepatocellular carcinoma. (A). Representative IHC staining results of hnRNPA1 in liver cancer tissues and non-tumor tissues (scale bar = 50 μm). (B). Statistical analysis of the mean density (IOD/area) of hnRNPA1 in the corresponding tissues. Results are presented as mean ± SD from 75 pairs of samples. ****P < 0.0001. (C). Representative IHC staining results of hnRNPA1 in T1-T3 stage (scale bar = 50 μm). (D). Statistical analysis of the mean density (IOD/area) of hnRNPA1 in the corresponding T stage. Data are expressed as the means ± SD, *P < 0.05, **P < 0.01 and ****P < 0.0001.
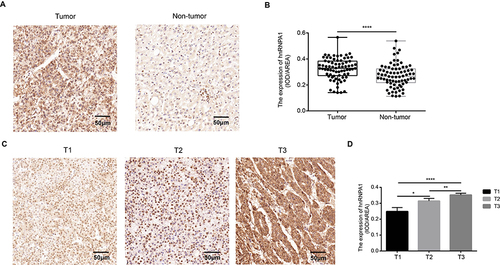
Figure 4 Knockdown hnRNPA1 leads to a significant inhibition effect on tumorigenesis in vivo. (A and B). Gross appearance of xenograft tumors after subcutaneous injections with sh-NC and sh-hnRNPA1 group (n = 5). (C and D). Tumor volumes (C) and weights (D) of the sh-NC groups and sh-hnRNPA1 group (n = 5). (E and F) Representative images of HE (E) and IHC for Ki-67 (F), scale bar = 50 μm. (G) Histogram analysis revealed that hnRNPA1 was associated with Ki-67 expression (n = 5). Data are expressed as the means ± SD. *P < 0.05 and ***P < 0.001.
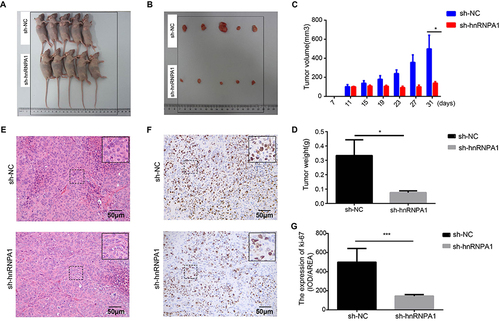
Figure 5 Reduced expression of hnRNPA1 decreases the proliferation, migration, and invasion, and promoted apoptosis in HCC cells. (A). Relative hnRNPA1 expression level in HepG2 and Huh7 cells transfected with si-RNAs targeting hnRNPA1 by qRT-PCR. (B–E) Proliferation of HepG2 and Huh7 cells after knockdown of hnRNPA1 by CCK-8 (B) and EDU assay (C–E), scale bar = 50 μm. (F–H) Representative results and statistical analysis of apoptosis in HepG2 (G) and Huh7 cells (H). (I–L). Representative results and statistical analysis of transwell assay (scale bar = 100 μm) in HCC cells after knockdown of hnRNPA1. Data are expressed as the means ± SD from three independent experiments. *P < 0.05, **P < 0.01, and ****P < 0.0001.
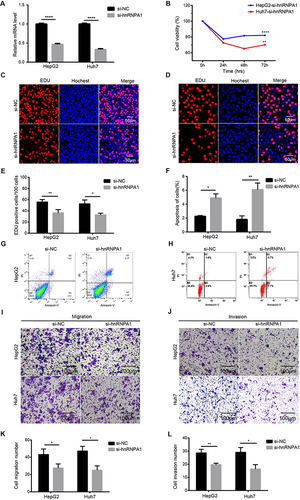
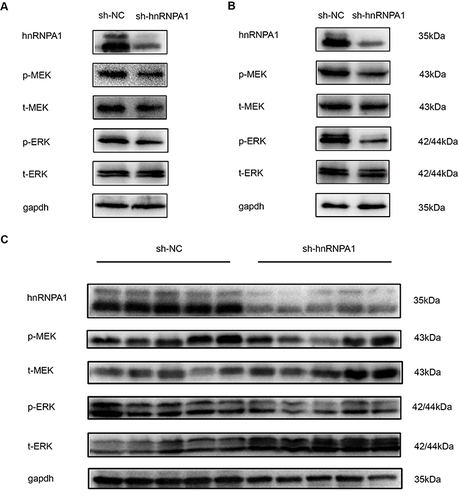
Figure 6 HnRNPA1 regulates the activity of MEK/ERK pathway in HCC. (A and B). Down regulation of hnRNPA1 reduces phosphorylation level of MEK/ERK pathway in HepG2 (A) and Huh7 (B). (C). Down regulation of hnRNPA1 reduces phosphorylation level of MEK/ERK pathway in vivo experiment (n = 5).