
Figures & data
Table 1 Comparisons of Baseline Demographics and Clinicopathological Characteristics in Patients Undergoing neoRT + LR or LR Alone Before and After Propensity Score Matching Analysis
Figure 1 Flow chart for patient screening.
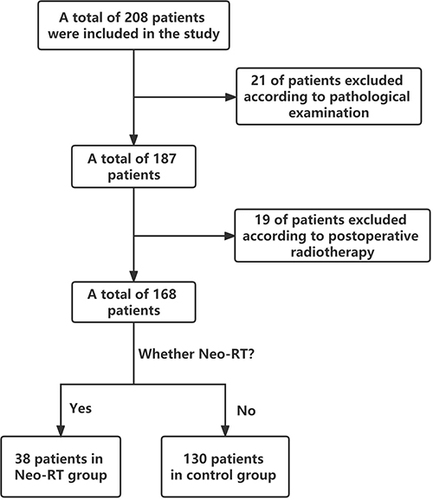
Table 2 Associations Between neoRT + LR and LR Alone Group in the Crude Analysis, Multivariable Analysis and Propensity-Score Analysis
Figure 2 Cox proportional-hazards regression in DFS.
Abbreviations: NeoRT, neoadjuvant radiotherapy; LR, liver resection; Cm, centimetre; AFP, Alpha-fetoprotein; ALT, Alanine aminotransferase; AST, Aspartate aminotransferase; TBIL, Total bilirubin.
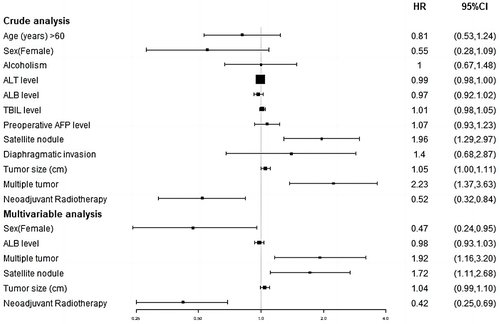
Figure 3 Kaplan–Meier curve of DFS before matching in neoRT+LR and LR groups.
Abbreviations: NeoRT, neoadjuvant Radiotherapy; LR, liver resection.
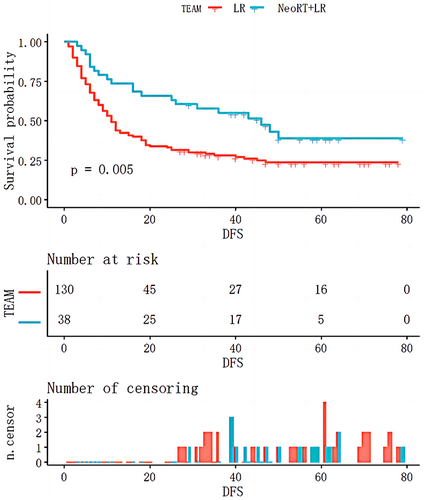
Figure 4 Kaplan–Meier curve of DFS after matching in neoRT+LR and LR groups.
Abbreviations: NeoRT, neoadjuvant Radiotherapy; LR, liver resection.
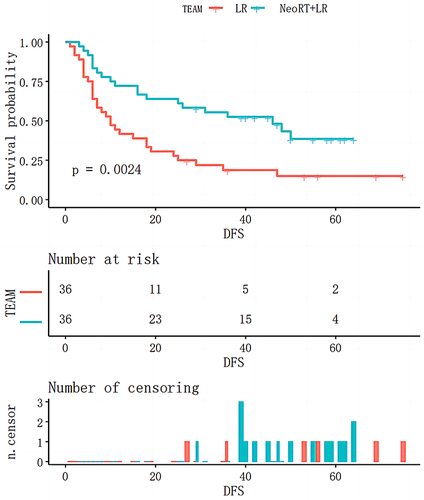
Table 3 Comparisons of Early Recurrence in Patients Undergoing LR+neoRT or LR